Variety Testing & Information Exchange 2024
The increasing number of wheat varieties available to Oklahoma producers underscores the need for thorough evaluation and comparison across different environments and management systems within the state. Annual wheat variety performance trials were conducted in 2024 to address this.
The data collected included grain yield in dual-purpose and grain-only production systems, forage yield, response to intensive management, adaptability to different environments, high-temperature sensitivity to germination, coleoptile length, lodging, plant height, first hollow stem date, heading date and resistance to leaf rust and stripe rust. The Oklahoma State University wheat variety testing program is the only one in the hard red winter wheat region that reports grain protein concentration in real-time, along with grain yield and test weight, providing stakeholders with the most comprehensive variety performance data. Up to 52 commercially available wheat varieties and six OSU candidate lines were tested in about 18 performance tests at 13 locations throughout Oklahoma (Figure 1).
Figure 1. The 2023-2024 Oklahoma Wheat Variety Performance Trials included standard and intensive management, grain-only vs. dual purpose, and late-planted short-season wheat varieties at 13 locations across Oklahoma.
Findings on variety performance and characteristics were shared via Extension publications, oral presentations and online communication platforms (Figure 2). For detailed results from the 2023-2024 season, refer to CR-2141, CR-2143 and CR-2135.
Figure 2. OSU Wheat Plot tour at Musick Farms in Sentinel.
Results from the forage trials informed producers about differences in fall forage production among wheat varieties and guided those in dual-purpose systems on the optimal timing for cattle removal. This helps minimize potential grain yield losses caused by grazing beyond the first hollow stem stage (Figure 3). For detailed results, refer to CR-2141.
Figure 3. A forage trial in Stillwater was used to collect fall forage yield and the first hollow stem date.
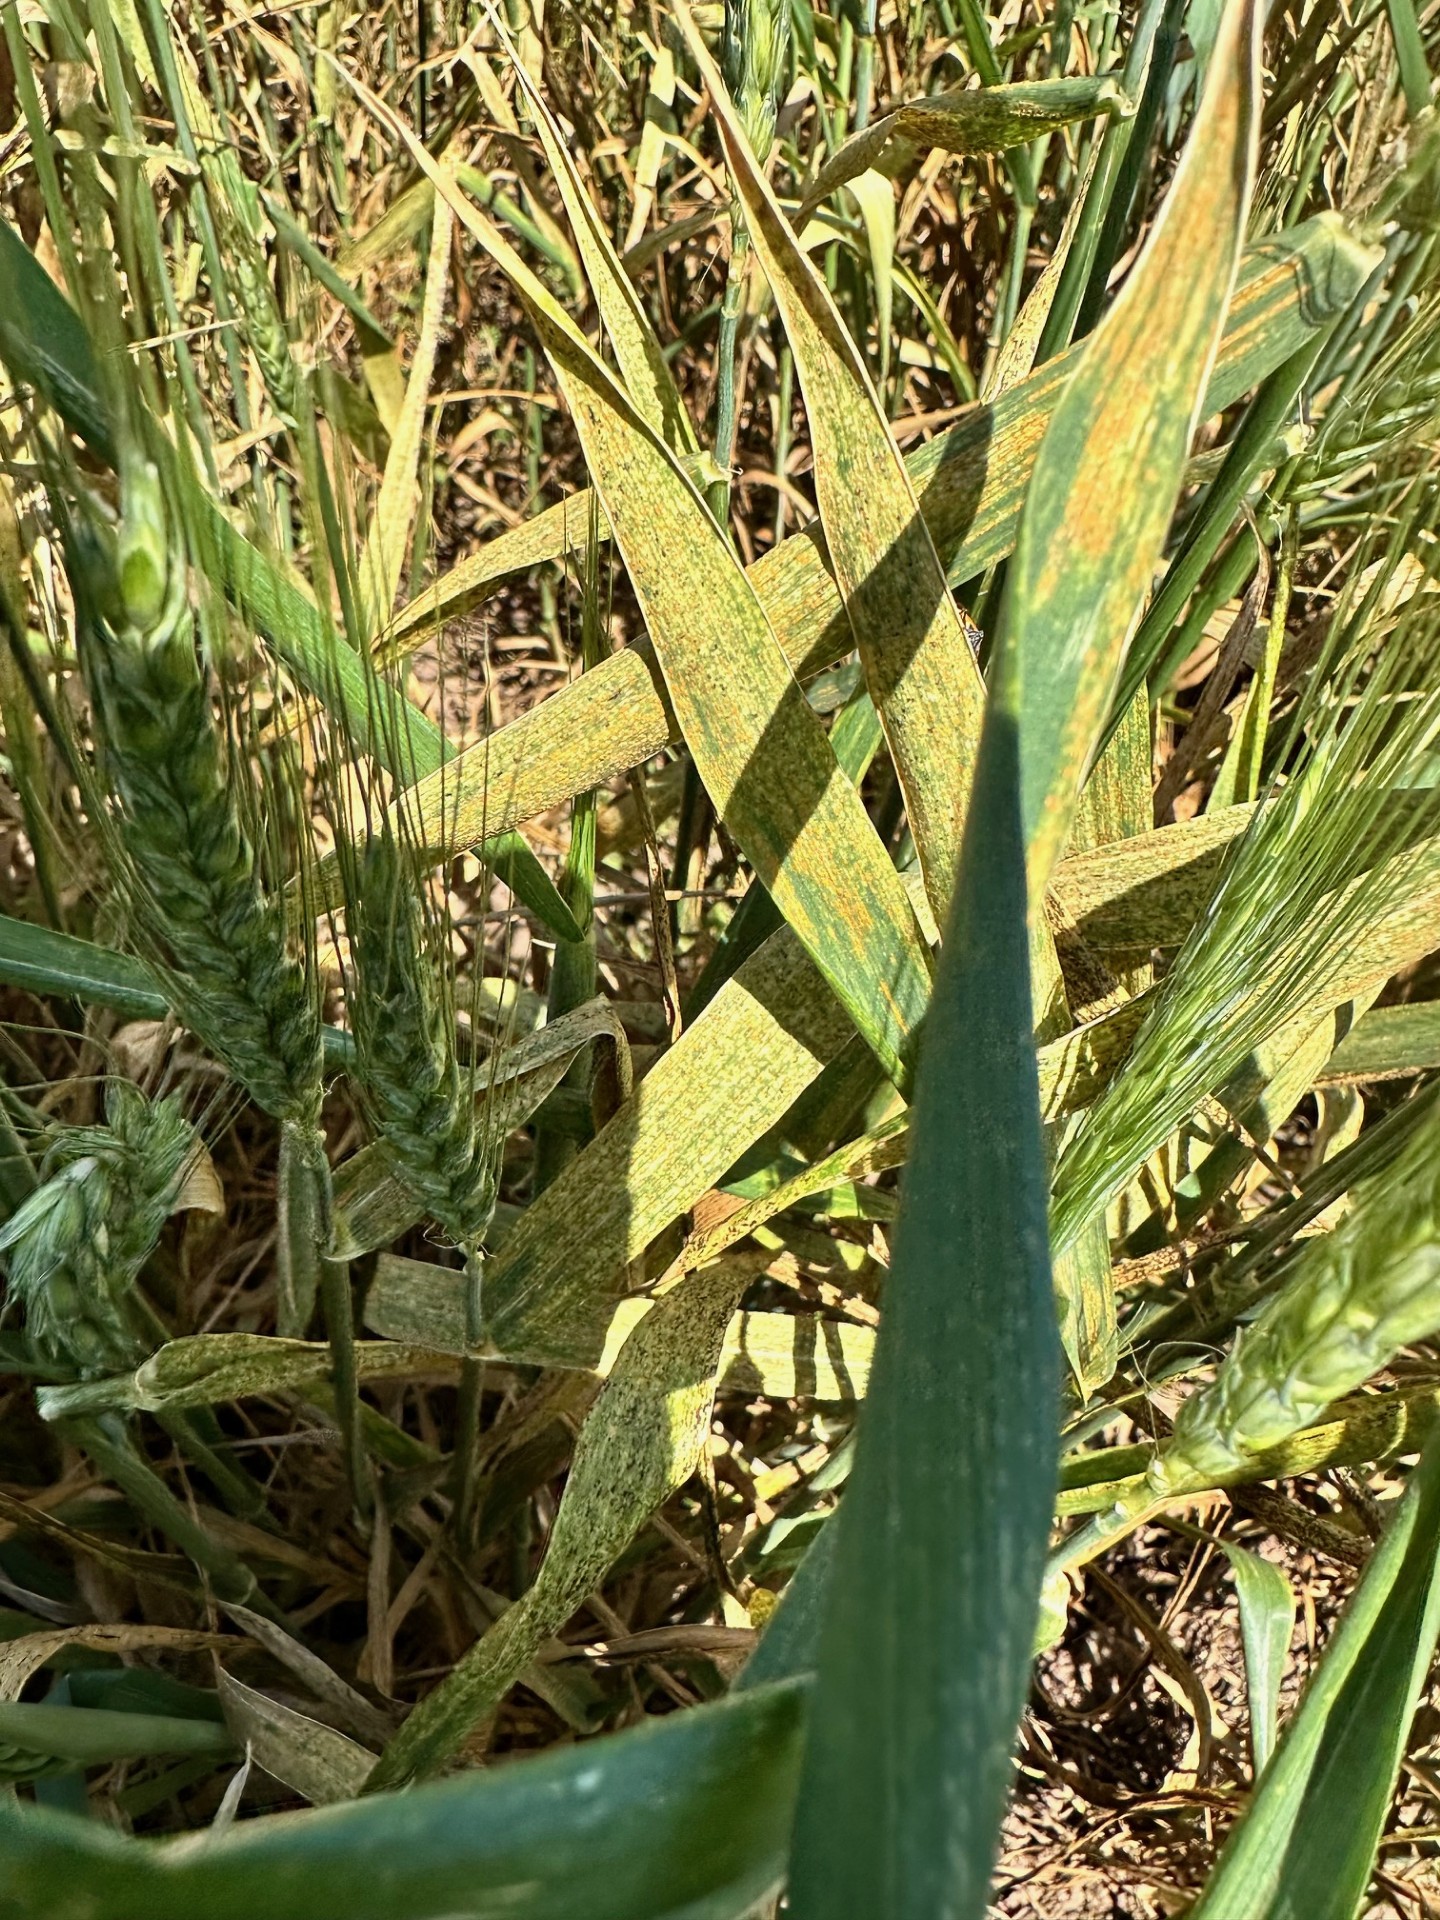
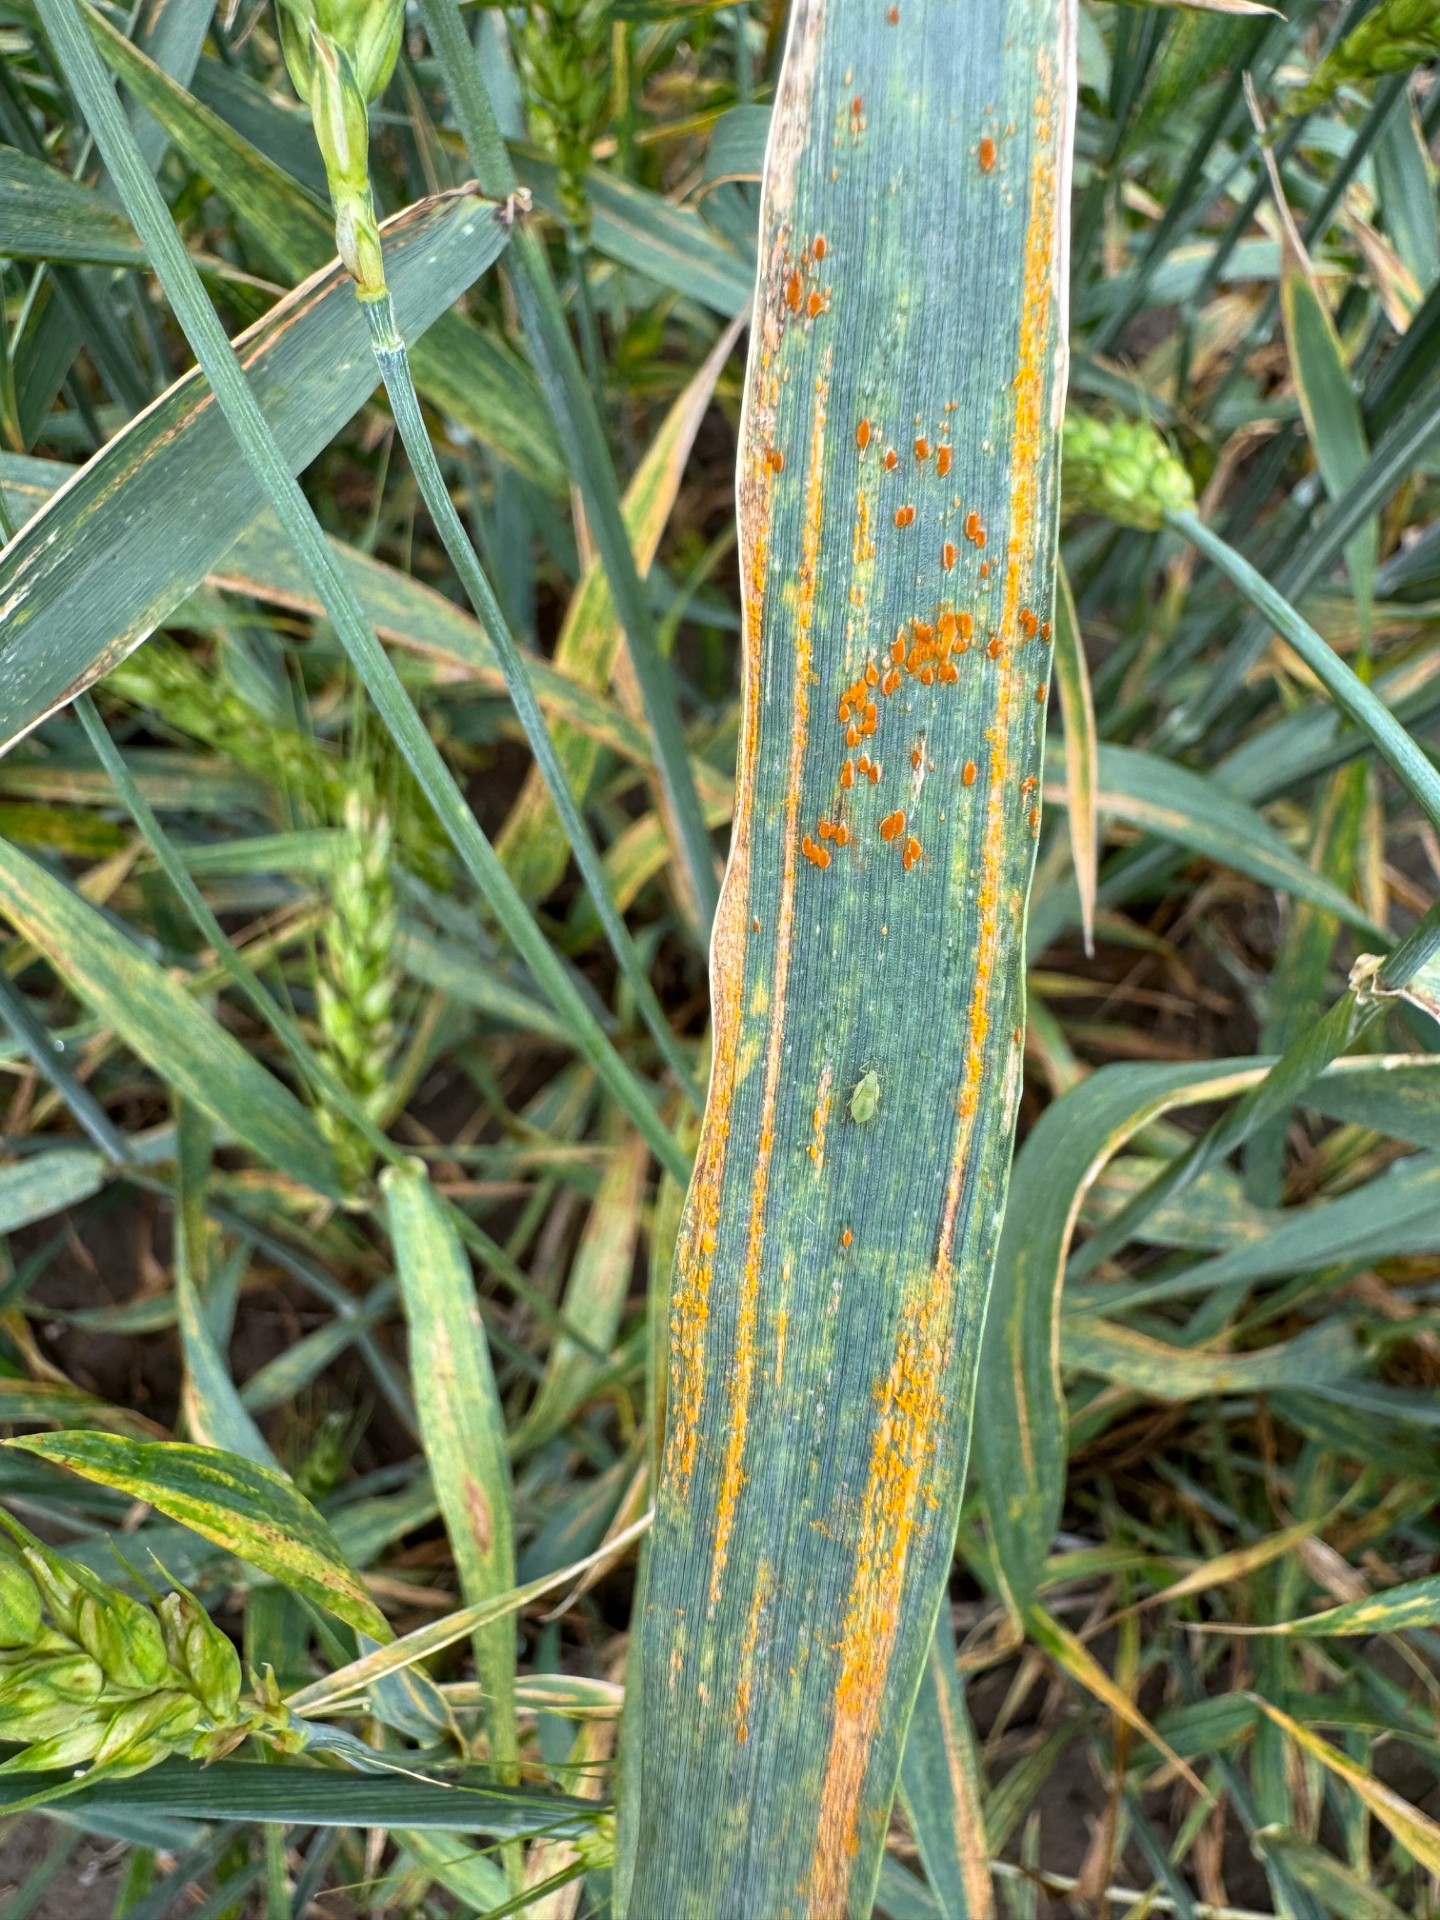
The central corridor trials at Altus, Kingfisher, Chickasha and Lahoma were used to promptly help producers understand the severity of stripe rust damage in 2024, which reached up to 100% depending on the variety. Refer to CR-2143 for the complete report (Figure 4).
Figure 4a-b. Wheat leaves with stripe rust and leaf rust in the variety trials at Walters and Kildare.
Figure 4a. Wheat leaves with stripe rust.
Figure 4b. Wheat leaves with leaf rust.
The 2024 variety trial at Lahoma featured intensive and standard management (IM and SM) treatment comparisons that showed an average yield gain of 10 bushels per acre across all varieties under the intensive treatment, with some varieties benefiting by an additional 36 bushels per acre (Figure 5).
At Chickasha, the trial showed an average yield increase of 15 bushels per acre, reaching up to 46 bushels per acre depending on the variety (Figure 5). Although it is not possible to separate the individual effects of increased nitrogen (N), seeding rate and fungicide applications within the intensive management treatment, the large yield increases were likely driven by fungicide relief to those varieties most susceptible to stripe rust, and a lesser extent, leaf rust.
Alternatively, some varieties tested at Lahoma under the standard management treatment (without fungicide applications) produced yields comparable to the average of the intensive management (IM) trials due to their strong resistance to stripe rust disease and its positive impact on yield (Figure 6). A similar trend was observed in Chickasha (CR-2143). These findings demonstrated to producers that the adoption of disease-resistant varieties can, in some cases, maintain the grain yield expected with fungicide protection even in the presence of severe disease pressure. Direct comparisons between treatments for each variety are reported in CR-2143. However, it's important to keep in mind that the IM system includes not just additional fungicide applications compared to the SM treatment but also a higher N rate and seeding rate. This could make it harder to directly compare varieties, as some may respond differently to these other factors.
Figure 5. Grain yield for the 2023-2024 OSU Wheat Variety Performance Trials with intensive management (Apache) and standard vs. intensive management comparisons (Chickasha and Lahoma) averaged across all varieties. The standard management included a seeding rate of 60 pounds per acre, an N rate estimated to achieve a 70-bushels per acre yield goal and no fungicide application. Intensive management consisted of planting at 1.2 million seeds per acre, an N rate targeted for a 100 bushels/acre yield goal and two fungicide applications — one at jointing and another at the flag leaf-boot stage. Information on individual variety responses to management can be found in CR-2143.
Figure 6. Grain yield for all varieties tested in the 2023-2024 OSU Wheat Variety Performance Trials in Lahoma. The horizontal black line represents the average yield of all varieties tested in the intensive management trials at Lahoma.
Next, the performance of eight wheat varieties tested across the state was broken out into regional comparisons (Tables 1, 2 and 3). In the southwest region, the average yield was 46 bushels/acre with OK Corral outperforming the regional average by 8 bushels/acre (Table 1). In the north-central and northwest regions, the average yield was 54 bushels/acre with Showdown exceeding the regional average by 6 bushels/acre (Table 2). In the central region, the average yield was 63 bushels/acre with Showdown and High Cotton yielding 5-6 bushels/acre above the regional average (Table 3). These findings highlight the broad adaptability of certain varieties across diverse environments, even under severe drought conditions like those experienced in 2024.
| Variety | Yield | Protein | TW |
|---|---|---|---|
| bu/ac | % | lb/bu | |
| OK Corral | 54 | 15.8 | 57.2 |
| Showdown | 48 | 13.6 | 58.2 |
| Paradox | 46 | 13.5 | 58.5 |
| Orange Blossom CL+ | 46 | 14.9 | 59.7 |
| High Cotton | 46 | 13.7 | 59.3 |
| KS Providence | 44 | 14.2 | 57.8 |
| OK20708 | 43 | 13.9 | 59.1 |
| Green Hammer | 39 | 15.5 | 59.0 |
| Mean | 46 | 14.4 | 58.6 |
| LSD | 10 | 1.3 | 1.0 |
| p value | 0.013 | <0.001 | <0.001 |
| Variety | Yield | Protein | TW |
|---|---|---|---|
| bu/ac | % | lb/bu | |
| Showdown | 60 | 13.3 | 59.9 |
| OK20708 | 57 | 14.3 | 60.4 |
| Orange Blossom CL+ | 55 | 14.9 | 62.2 |
| KS Providence | 54 | 14.6 | 58.9 |
| High Cotton | 53 | 14.0 | 61.1 |
| OK Corral | 53 | 13.7 | 59.0 |
| Paradox | 53 | 14.1 | 59.5 |
| Green Hammer | 50 | 15.8 | 60.7 |
| Mean | 54 | 14.3 | 60.2 |
| LSD | 7 | 0.7 | 0.8 |
| p value | 0.011 | <0.001 | <0.001 |
| Variety | Yield | Protein | TW |
|---|---|---|---|
| bu/ac | % | lb/bu | |
| Showdown | 69 | 11.3 | 58.3 |
| High Cotton | 68 | 11.7 | 59.5 |
| Paradox | 66 | 11.6 | 58.1 |
| Orange Blossom CL+ | 64 | 12.4 | 60.2 |
| OK20708 | 63 | 11.5 | 58.0 |
| KS Providence | 60 | 12.2 | 57.6 |
| OK Corral | 58 | 11.4 | 57.8 |
| Green Hammer | 58 | 13.1 | 59.3 |
| Mean | 63 | 11.9 | 58.6 |
| LSD | 6 | 0.5 | 0.7 |
| p value | <0.001 | <0.001 | <0.001 |
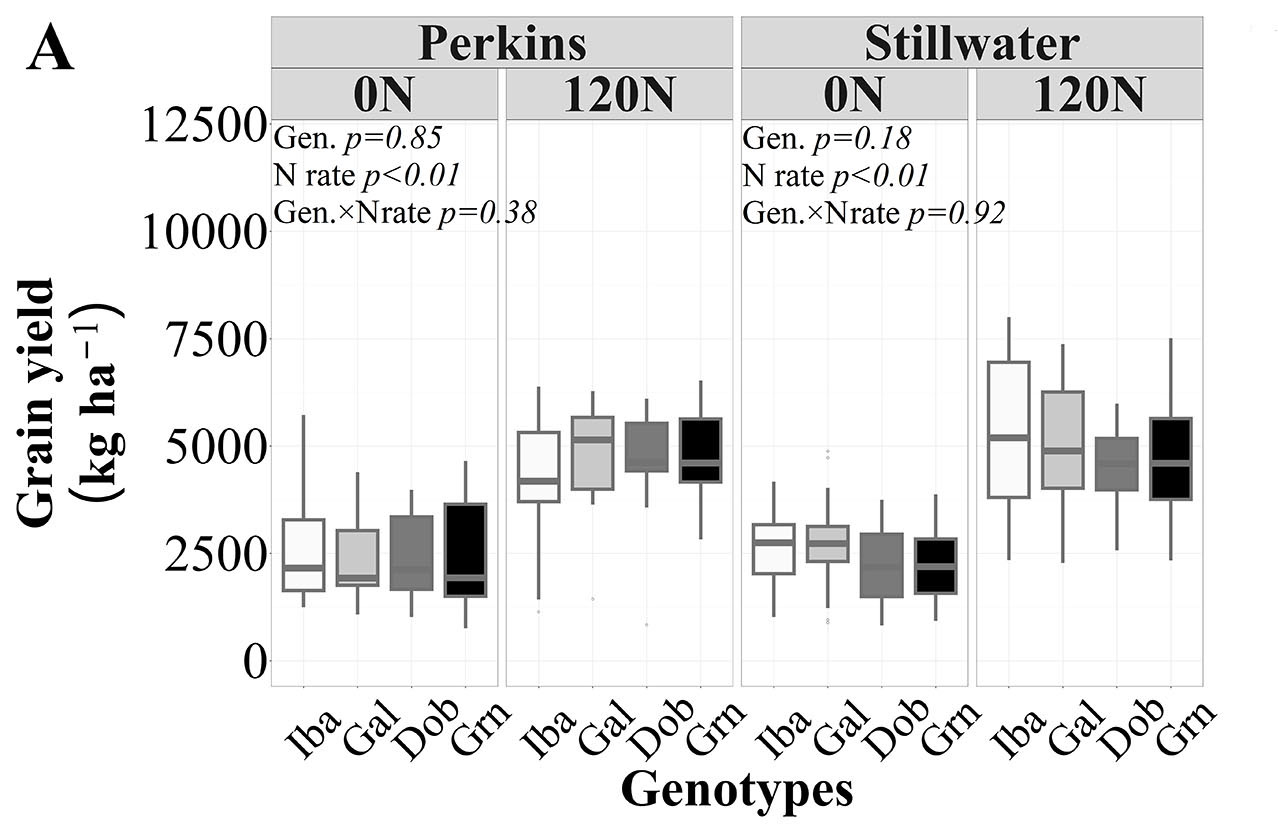
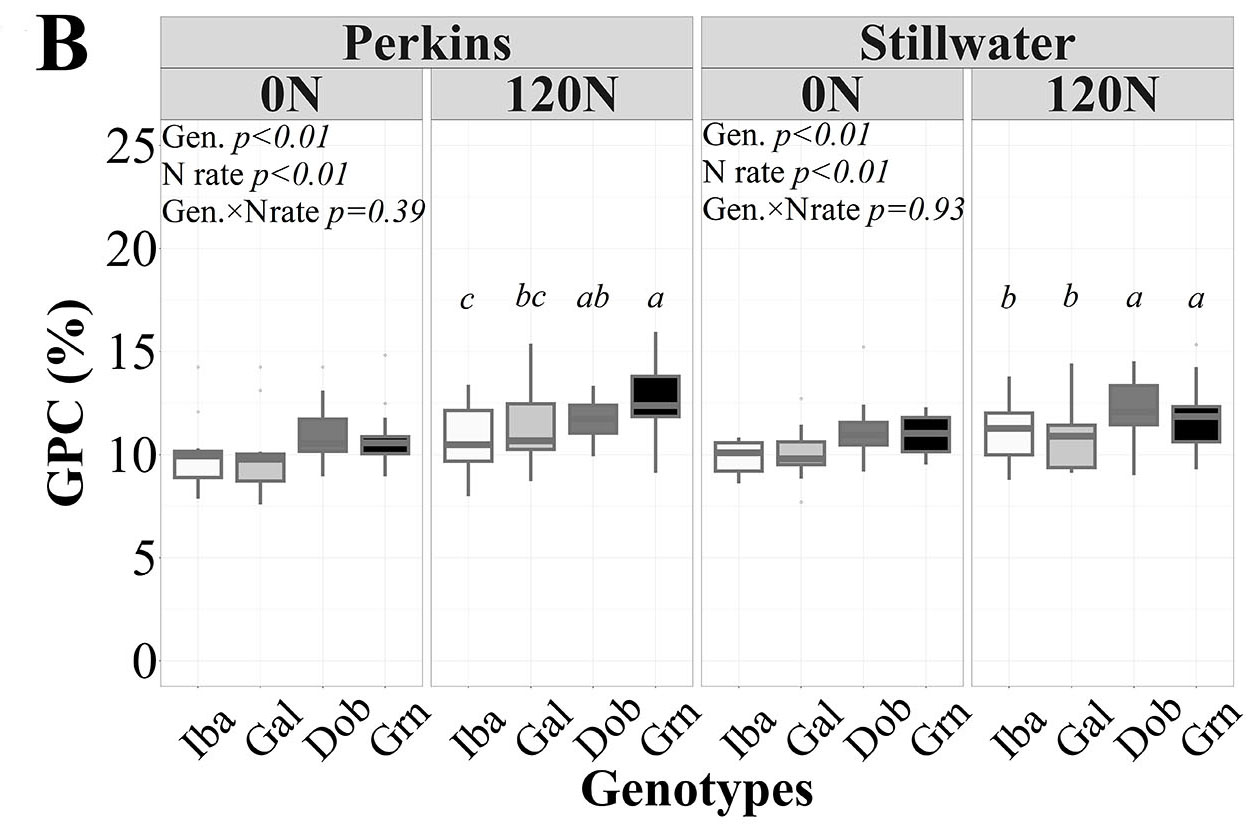
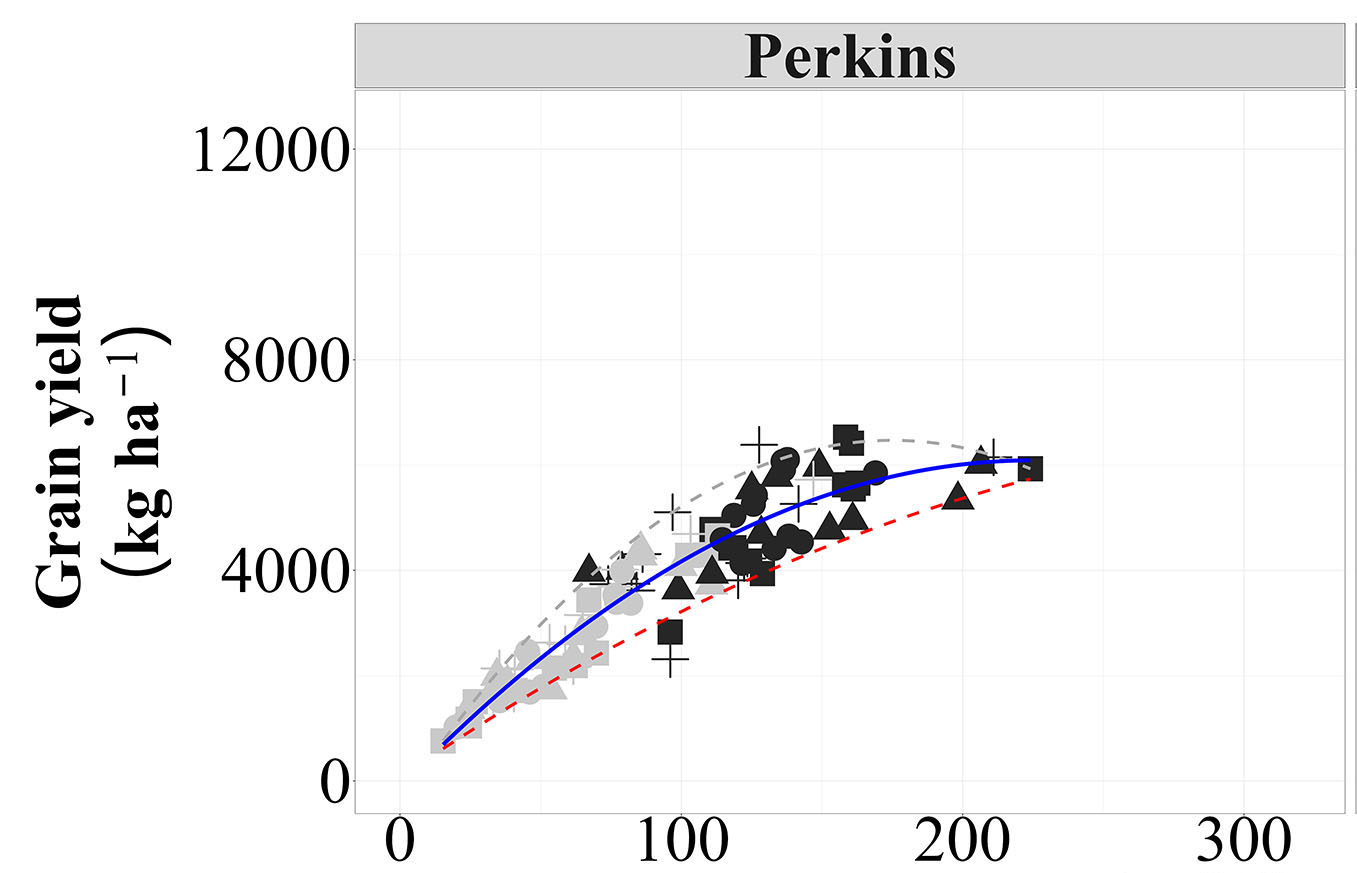
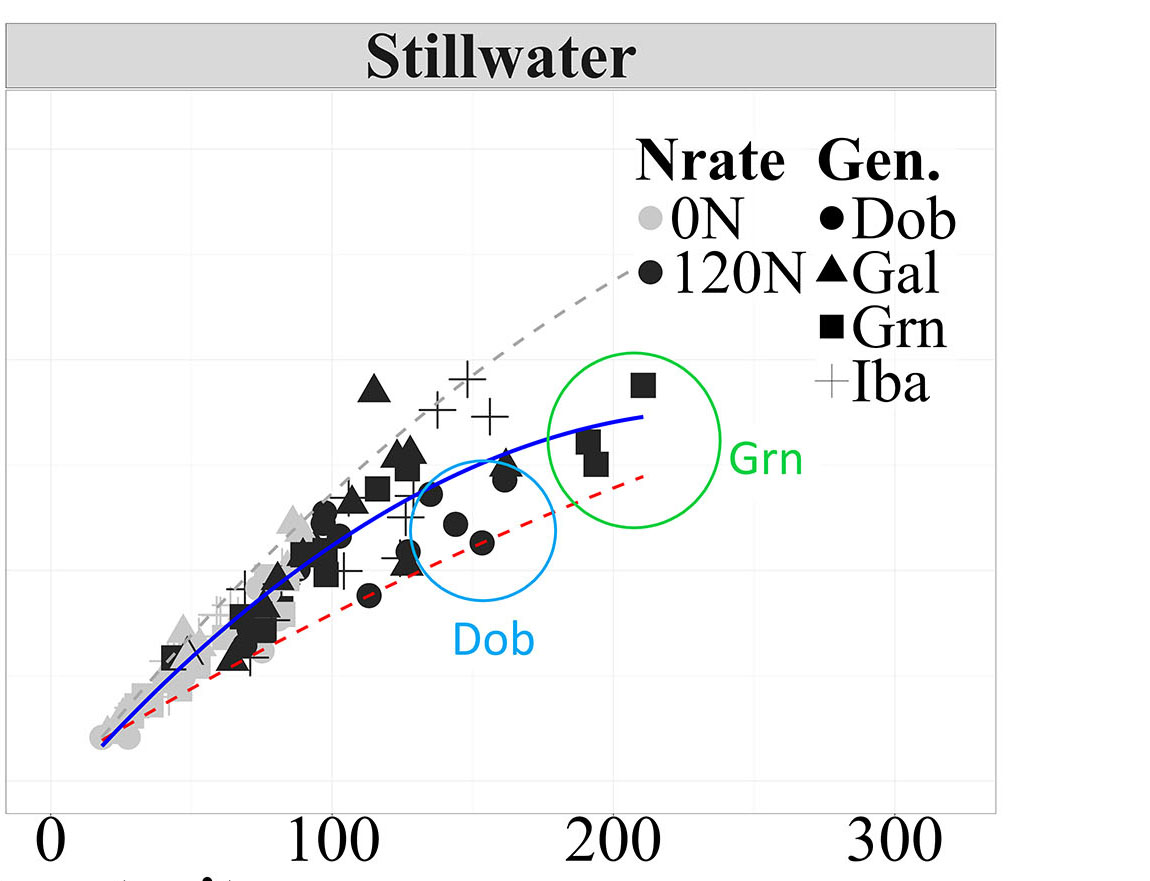
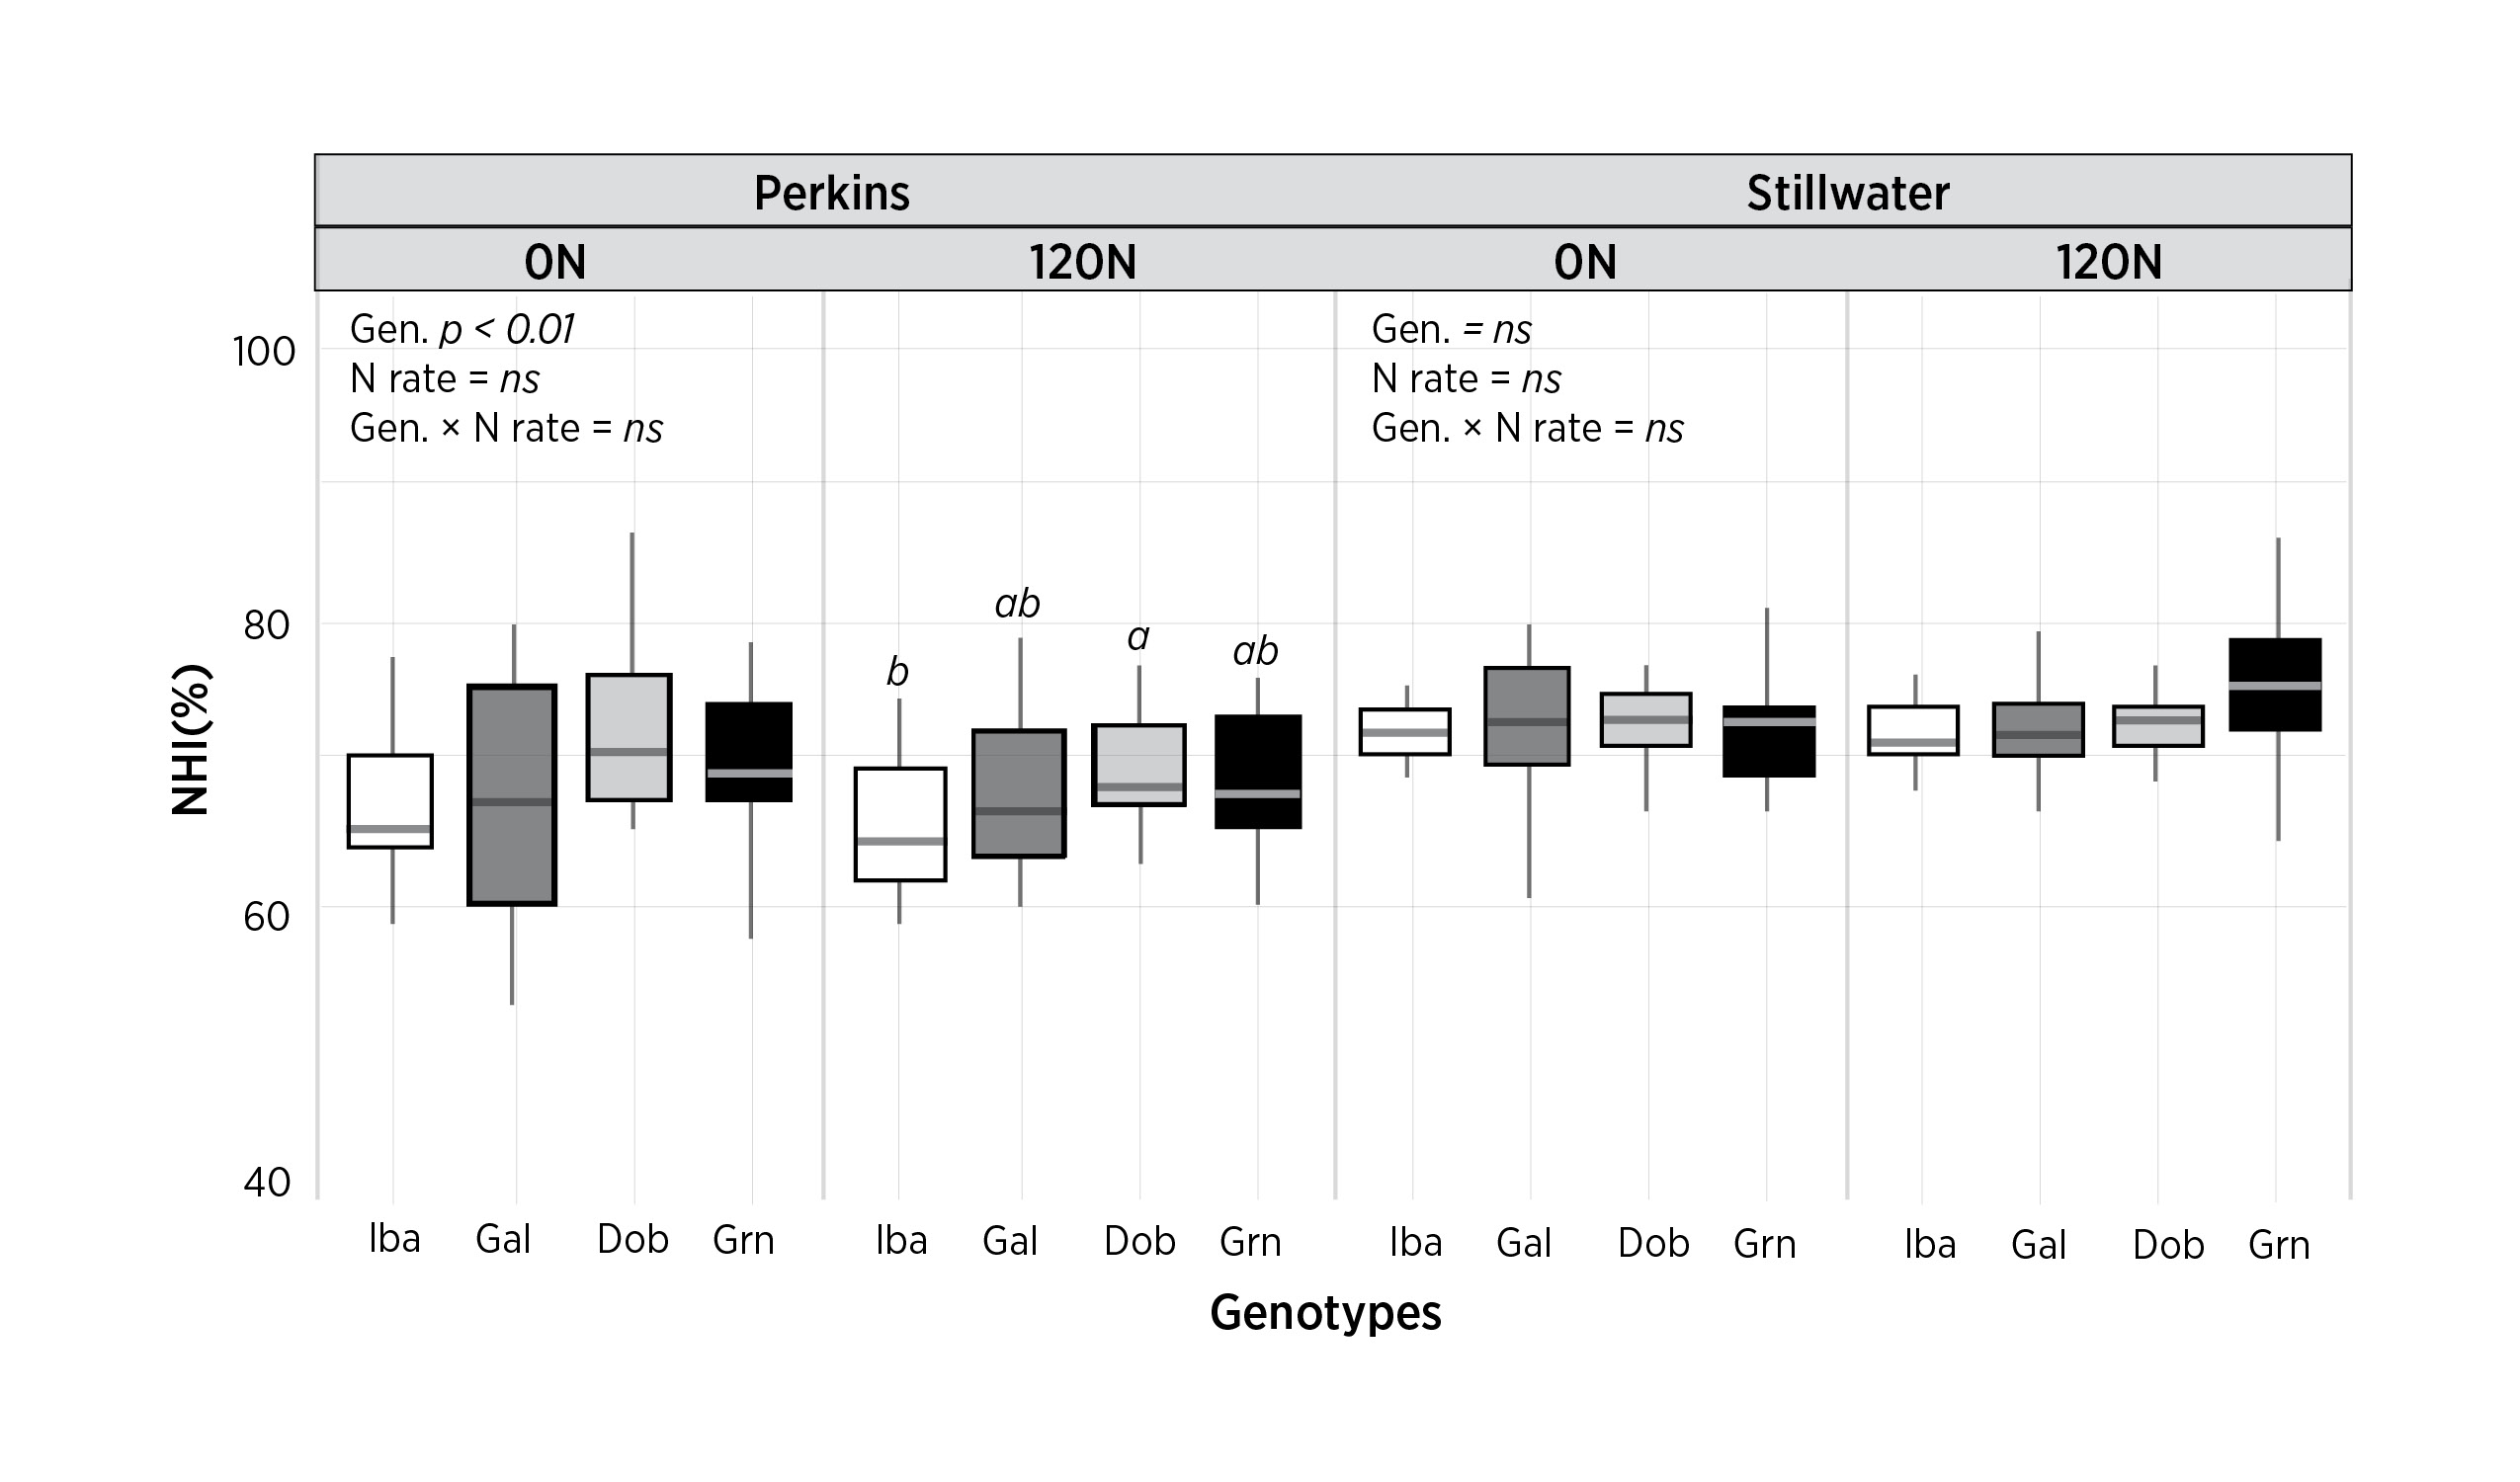
Additionally, we assessed Gallagher, Iba, Green Hammer and Doublestop CL Plus for their ability to achieve high grain yield while minimizing protein loss under both low and high N availability (Figure 7). This was done by evaluating N accumulation in different plant components throughout the growing season. Our research demonstrated that wheat varieties employ distinct strategies to attain high protein levels. For example, Green Hammer achieved this through higher N uptake, while Doublestop CL Plus relied on greater N partitioning to the grain (i.e., N harvest index; NHI) (Figures 8 and 9).
We also found that N remobilization patterns vary between high- and low-protein genotypes, with leaf N remobilization playing a crucial role in maintaining plant N status and contributing to protein levels in high-protein varieties. These findings were published in Frontiers in Plant Science and can be accessed here: [Manuscript].
Figure 7a-b. Grain yield (A) and grain protein concentration (GPC) responses to 0 and 120 pounds per acre N across four years (2020-2023) for Gallagher (Gal), Green Hammer (Grn), Doublestop CL Plus (Dob).
Figure 7a. Grain Yield
Figure 7b. Grain Protein Concentration
Figure 8a-b. The relationship between grain yield and total N accumulation at maturity across N rates for Gallagher (Gal), Green Hammer (Grn), Doublestop CL Plus (Dob).
Figure 8a. Perkins
Figure 8b. Stillwater
Figure 9. Nitrogen harvest index (NHI, %) for each variety at 0 and 120 pounds per acre N across four years (2020-2023) for Gallagher (Gal), Green Hammer (Grn), Doublestop CL Plus (Dob).
Figure 10. 2024 OSU Small Grains Team


