Genome-Wide Analysis
Duster Genome
In the last decade, environmental stresses and extreme weather events have caused large-scale damage to crop production worldwide. For example, from 1980 to 2015, a 21% global yield reduction in wheat was attributed to global drought. Due to a multi-year drought, wheat production in the United States decreased to 51 million bushels in 2014, half of the 2013 production. Regionally, the 2020 Drought Monitor revealed 70% of Oklahoma had been exposed to intense drought in the last 10 years. Understanding and developing genetic resilience for winter wheat in a drought-prone environment is thus vital to securing long-term agricultural sustainability.
The ability of plants to cope with environmental changes relies on a series of adaptive
mechanisms, including physiological response, genome-wide gene expression, regulatory
machinery and genomic variations, such as structural variants, mutations and novel
genes. To establish a comprehensive catalog of the adaptive genomic elements for Oklahoma
State University's local winter wheat varieties, Wheat Improvement Team (WIT) led
a seminal effort to construct a reference genome assembly of Duster, an important
winter wheat to Oklahoma.
The sequencing project began in late 2018. To date, WIT has generated >40 terra
base pairs (Tb) of DNA sequencing data. Though still ongoing, the analysis showed
that in the resulting 15.2 Gb genome assembly, the contigs have an N50 over 140.6
Kb (50% of the entire assembly is contained in contigs equal to or larger than this
value) and guanine-cytosine (GC) content of 45.7%. Both statistics are comparable
to the International Wheat Genome Sequencing Consortium reference sequence or genome
assembly, called IWGSC RefSeq v2.0.
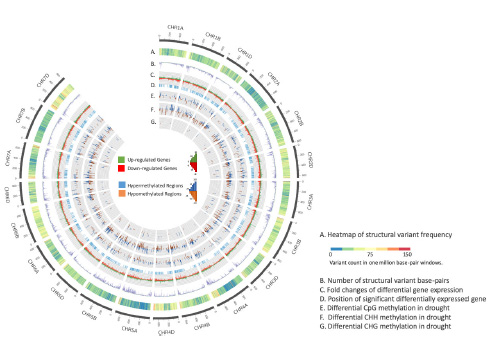
Considering unique genomic features other than single nucleotide polymorphisms (SNPs), the Duster genome exhibits extensively marked alterations (Figure 1B). Directly aligning Duster sequencing reads to the IWGSC RefSeq v2.0 revealed the majority of the variations occur in the form of structural variants, that is, sequence variations with greater than 50 base-pair changes, such as deletions (294 Mb) and insertions (142 Mb). On average, 4.5% of the Duster genome and 658 Mb of base-pair changes are impacted by structural variants, compared with 1.5% found in between any two humans when considering both SNPs and structural variants. The greatest density of structural variants per million base pairs resided in the telomeric regions of chromosomes 4, 7A and 7D (Figure 1A); however, chromosome 3A showed the largest number of base-pair changes by large tandem duplications (12.5 Mb).
Studies in crop plants have already shown structural variants can disrupt gene functions
irregulation, or modify gene dosage, resulting in pronounced phenotypic and physiological
changes. For example, a specific tandem duplication in wheat covering the Rht-D1b
gene reduced plant height by 70%. Structural variants also have been associated with
stress tolerance phenotypes in barley.
Figure 1. Circular diagram showing genome features of the Duster genome with the IWGSC RefSeq v2.0 genome coordinates. The tracks of the circle display: a) the frequency of all identified structural variants in one-million base-pair windows, b) the number of base pairs altered by the identified structural variants, c) the log10 transformed-fold changes of differential gene expression across the genome under water stress conditions, d) genome positions of the differential genes and e to g) differential methylations, including hypomethylation and hypermethylation, for CpG, CHG and CHH sequence context in water stress conditions.
Duster Epigenome
To quantify changes in gene expression and methylation associated with abiotic stresses, Duster and a Billings x Duster experimental progeny named OK12D-Blgs/Dst-DH169 (hereafter DH169) were grown in a controlled drought-stress experiment. DH169 was once considered a candidate for release for its putative nitrogen-use efficiency. Water was withheld from the treatment group at Feekes’ 10th stage (boot) of growth for six consecutive days, while control pots continued with regularly scheduled watering. Daily water loss was tracked gravimetrically, and flag leaf samples of both control and treatment plants were collected for sequencing after the six-day experiment.
For Duster, the assemblies of the expressed transcripts had an N50 of 2,118 base pairs, with the largest transcript containing 15,651 base pairs. The average guanine-cytosine content across all transcripts was 55.9%. In Table 1, the numbers of expressed genes in the water-reduction experiment, as well as the counts of transcripts and exons, showed that overall, Duster and DH169 responded similarly. Under water stress, both winter wheat genotypes displayed an indifferent degree of down-regulation, with 1,180 and 1,160 down-regulated genes in DH169 and Duster, respectively. However, when investigating up-regulation of gene expression under water stress, 1,187 genes were found to have an increased expression in DH169, but only 523 genes were up-regulated in Duster (Figures 1C, 1D).
| Genotype | Genes | Transcripts | Exons | GC content |
|---|---|---|---|---|
| Duster | 62,240 | 99,218 | 599,342 | 55.87% |
| DH169 | 63,781 | 101,280 | 611,178 | 56.27% |
Cytosine methylation is a common feature associated with critical genetic processes related to gene activity regulation and the upkeep of genome integrity under stress. In plants, cytosine methylation is found in three sequence contexts: CG, CHG and CHH (where H = A, T or C bases), each with distinct mechanisms for establishing, maintaining and removing the methylation mark. In this study using a reduced representation method, the total number of cytosines analyzed were 1,208 million for Duster and 1,263 million for DH169.
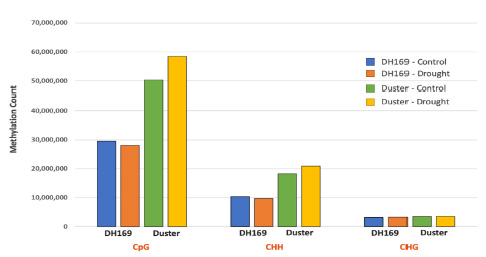
The methylation calls across all sequence contexts for Duster and DH169 are summarized in Figure 2. For DH169, 43.1 million of the analyzed cytosine was methylated in the control condition. Under water stress, the number of methylated cytosines slightly decreased to 41.1 million (Figure 2). On the contrary, the total number of methylated cytosines in the Duster genome under water stress was 83 million, 10.7 more than that in the control condition and almost twice as much as the methylation found in DH169 (Figure 2). Overall, the proportion of the cytosines methylated was 23.4% (well-watered) and 28.0% (water stress) for Duster; and 13.9% (well-watered) and 12.9% (water stress) for DH169.
The methylation calls across all sequence contexts for Duster and DH169 are summarized in Figure 2. For DH169, 43.1 million of the analyzed cytosine was methylated in the control condition. Under water stress, the number of methylated cytosines slightly decreased to 41.1 million (Figure 2). On the contrary, the total number of methylated cytosines in the Duster genome under water stress was 83 million, 10.7 more than that in the control condition and almost twice as much as the methylation found in DH169 (Figure 2). Overall, the proportion of the cytosines methylated was 23.4% (well watered) and 28.0% (water stress) for Duster; and 13.9% (well watered) and 12.9% (water stress) for DH169.
Figure 2. The overall methylation cytosine counts in the sequence context of CpG, CHG, and CHH for Duster and DH169, in well watered and water stress conditions.
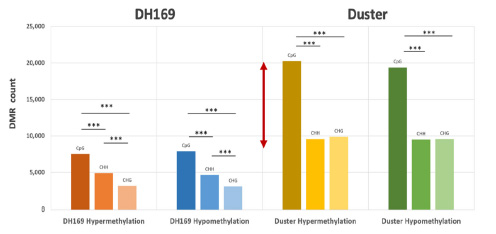
Differential analysis also was conducted to determine the genomic regions where methylation changes were induced by the imposed water stress condition. Compared with the differential methylation regions found in DH169, a significantly higher number of Duster genomic regions was found modulated by methylation mechanism under water stress (Figure 3). Further depicted in Figure 1 (tracks E, F and G), the results indicate the Duster genome underwent extensive, epi-genetically dynamic methylation changes under water stress, and the identified methylation changes were dominated by the CpG sequence context for both hypomethylation and hypermethylation.
Figure 3. Differential methylation regions of CpG, CHG and CHH sequence contexts in Duster and DH169, and their respective hypermethylation and hypomethylation. The *** is indicative of statistical significance with p-value < 0.001.


