Variety Testing & Information Exchange 2021
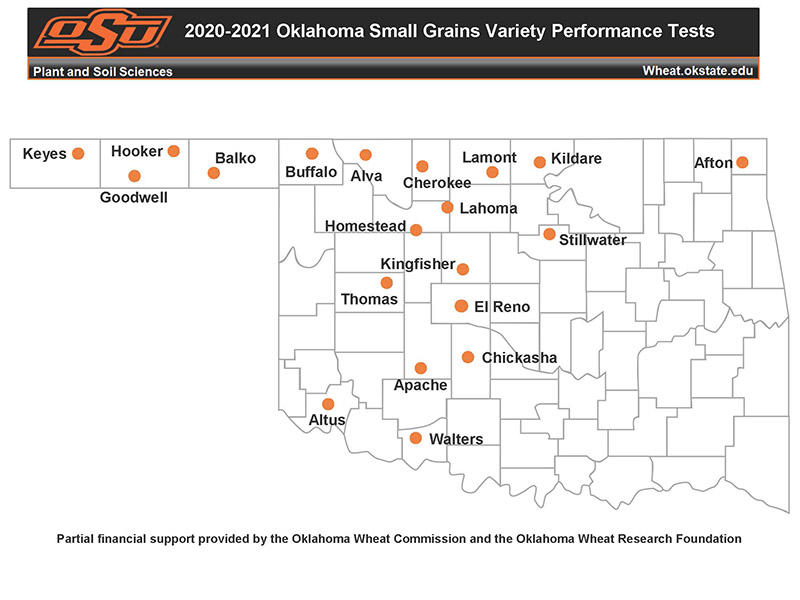
An ever-evolving number of hard red and hard white wheat varieties available to Oklahoma wheat producers necessitates their annual evaluation and comparison. In 2021, wheat variety performance trials were established to evaluate yield potential and quality characteristics of 51 commercially available wheat varieties and seven candidate varieties. These 58 genotypes were distributed among 24 variety performance trials across Oklahoma, including fungicide and intensive management trials (Figure 1). Two trials were specifically designed to measure fall forage production for up to 45 of the 58 varieties (Figure 2).
In all, the data collected from these trials included grain yield under dual-purpose and grain-only production systems, forage yield, response to fungicide application, disease reactions, high-temperature sensitivity to germination, plant height, first hollow stem date and heading date. For the second consecutive year, wheat protein concentration was reported together with grain yield and test weight.
Information regarding variety performance and characteristics was distributed through extension publications, oral presentations and web-based communications (see CR-2141, CR-2143 and CR-2135 for detailed results). Plot maps and stakes were installed at each location for producers interested in a self-guided plot tour (Figure 3). The variety trials are the most influential decision-making tool used by producers in their planting operations. These data represent an unbiased source of information to help growers make better-informed decisions and are generally the only source of variety data in Oklahoma for dual-purpose wheat production.
Figure 1. Locations for the 2020-21 Oklahoma small grains variety performance tests.
Figure 2. Forage yield trials conducted in Stillwater during the 2020-21 crop year as published in CR-2141.
Figure 3. On-site field maps were provided for producers interested in conducting a self-guided plot tour, and variety information could be accessed via QR-coded signage.
Variety Responsiveness to Management – Disease Protection
Two of the 2020-21 Oklahoma small grains variety performance tests included a fungicide vs. non-fungicide treatment comparison, hereafter called fungicide trials. One other test included a more comprehensive standard vs. intensive management treatment comparison, hereafter called the intensive management trial. For the fungicide trials, the non-fungicide treatment had no fungicide treatment application during the season, while the fungicide treatment involved one application at flag leaf emergence. For the intensive management trial, the standard management treatment had no fungicide application, and the N rate was calculated for a yield goal of 70 bushels per acre. The intensive management treatment included two fungicide applications (one at jointing and one at flag leaf emergence) and an additional 40 pounds of N per acre as topdress application. See CR-2141 for complete information about the sites and varieties tested.
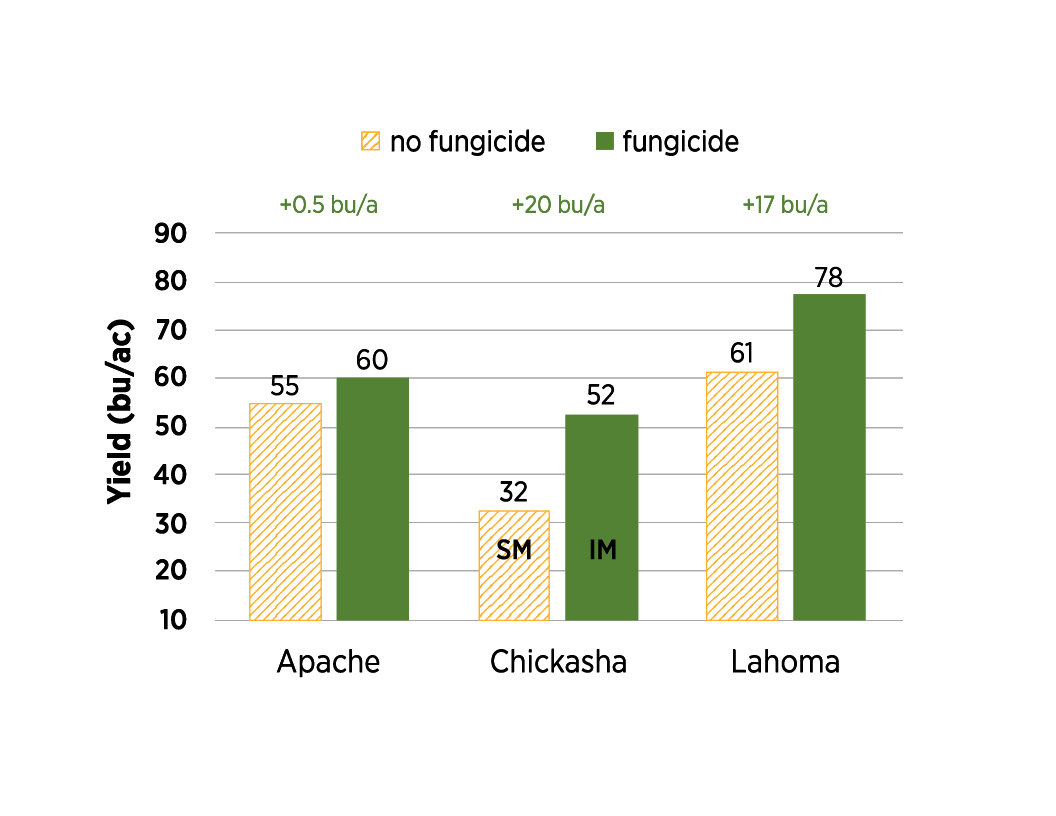
Figure 4. Grain yield comparisons for fungicide vs. non fungicide treatment comparisons (Apache and Lahoma) and for a standard vs. intensive management treatment comparison (Chickasha), averaged across all varieties tested. Information on individual varietal responses in grain yield for these and all other variety trials in 2021 may be found at CR-2143.
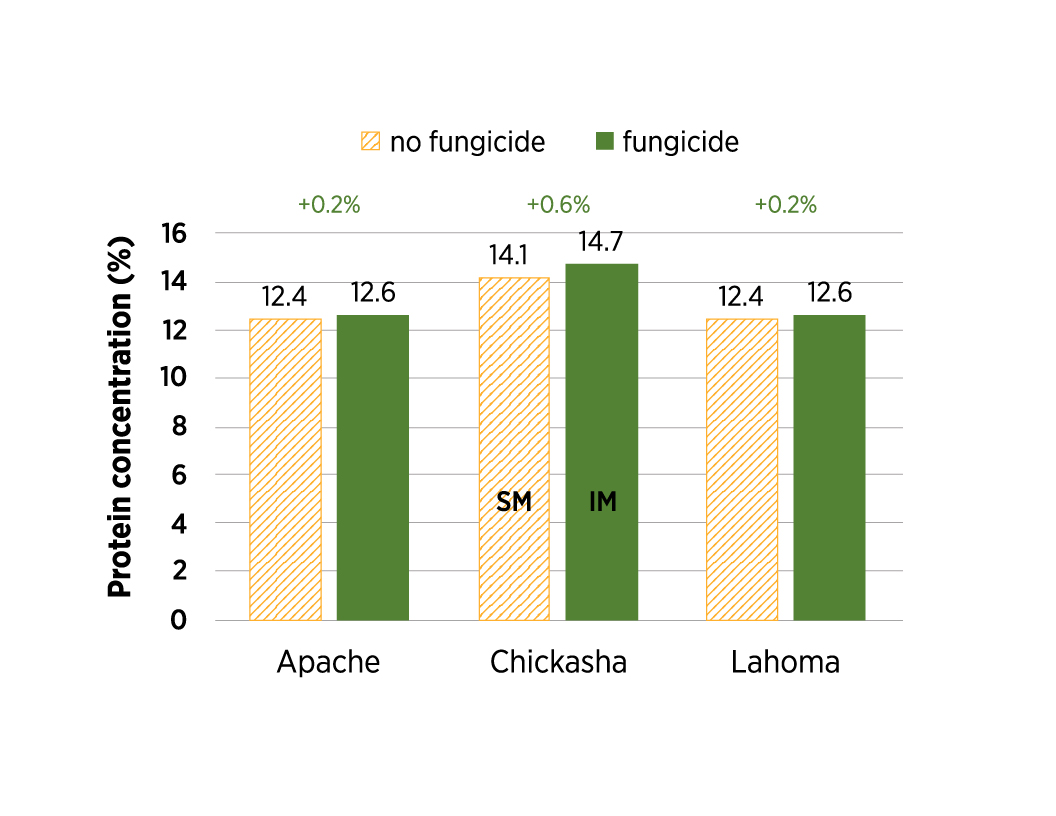
Figure 5. Wheat protein concentration comparisons for fungicide vs. non fungicide treatment comparisons (Apache and Lahoma) and for a standard vs. intensive management treatment comparison (Chickasha), averaged across all varieties. Information on individual varietal responses in wheat protein for these and all other variety trials in 2021 may be found at CR-2135.
Severe stripe rust and leaf rust pressure occurred during grain-fill at Lahoma in 2021. The fungicide treatment provided a yield gain of 17 bushels per acre across all varieties and up to 27 bushels per acre for the more susceptible varieties at Lahoma (Figure 4). Wheat protein concentration increased a negligible 0.2% on average for all varieties in response to a fungicide application, although individual varieties varied widely in their protein response (Figure 5). At Lahoma, the degree to which yield was improved by fungicide application on a given variety had nothing to do with the degree to which its wheat protein concentration was impacted (Figure 6A). A similar disassociation between grain yield and wheat protein responses was found at Apache (Figure 6B), where stripe rust pressure was the predominant yield-limiting factor. These trials indicate that protection from fungicides may provide a yield increase at no expense to wheat protein concentration, as long as ample soil nitrogen is present to support the yield increase.
The intensive management trial at Chickasha showed a yield increase of 20 bushels per acre averaged across all varieties in response to the intensive management treatment (Figure 4). Yield deviation values varied up to 41 bushels per acre depending on the variety. This demonstrates to producers that adequate management practices and variety selection can help raise wheat production in the state while also benefiting grain quality.
Figure 6. Change in wheat protein concentration, or deviation, versus change in grain yield in response to a fungicide application among 57 varieties at Lahoma (A) or 26 varieties at Apache (B). P >0.05 for either location. Links to each trial with complete yield results.
Variety Responsiveness to Management – Grazing
The 2020-21 Oklahoma small grains variety performance tests included one location with a grain-only and dual-purpose system comparison. Averaged across all varieties, grain yield decreased five bushels per acre from grain-only to the dual-purpose system (Table 1). Although some variation existed among varieties, protein concentration was unaffected by the system across the sample of varieties featured in this trial (CR-2143).
| Variety | Dual-purpose | Grain-Only | Diff |
|---|---|---|---|
| Showdown | 75 | 78 | -3 |
| Bob Dole | 61 | 69 | -8 |
| Big Country | 63 | 67 | -4 |
| Strad CL+ | 62 | 66 | -4 |
| WB4401 | 50 | 67 | -17 |
| Doublestop CL+ | 62 | 66 | -4 |
| OK Corral | 63 | 66 | -3 |
| Green Hammer | 52 | 66 | -14 |
| SY Rugged | 62 | 64 | -2 |
| Gallagher | 50 | 64 | -14 |
| WB4792 | 62 | 64 | -2 |
| AM Cartwright | 58 | 64 | -6 |
| LCS Chrome | 57 | 62 | -5 |
| Uncharted | 64 | 61 | 3 |
| Smith's Gold | 59 | 60 | -1 |
| Baker's Ann | 60 | 58 | 1 |
| KS Dallas | 62 | 58 | 4 |
| KS Western Star | 59 | 58 | 1 |
| WB4269 | 53 | 55 | -2 |
| KS Silverado | 57 | 51 | 6 |
| Experimentals | |||
| OK12716W | 76 | 75 | 1 |
| OK15MASBx7 ARS 8-29 | 55 | 69 | -14 |
| OK15DMASBx7 ARS6-8 | 66 | 65 | 1 |
| OCW03S580S-8WF | 43 | 59 | -16 |
| Mean | 59 | 63 | -5 |
| LSD (0.05) | 5 | 4 | 7 |


