Information Exchange
2020 Variety Trials
An ever-evolving number of wheat varieties available to Oklahoma wheat producers necessitates their evaluation and comparison in scientific trials. To address this need, the wheat variety performance trials are currently designed to evaluate yield potential and quality characteristics of approximately 25 to 45 released varieties and two to five candidate varieties at approximately 20 locations throughout Oklahoma every year (Figure 1).
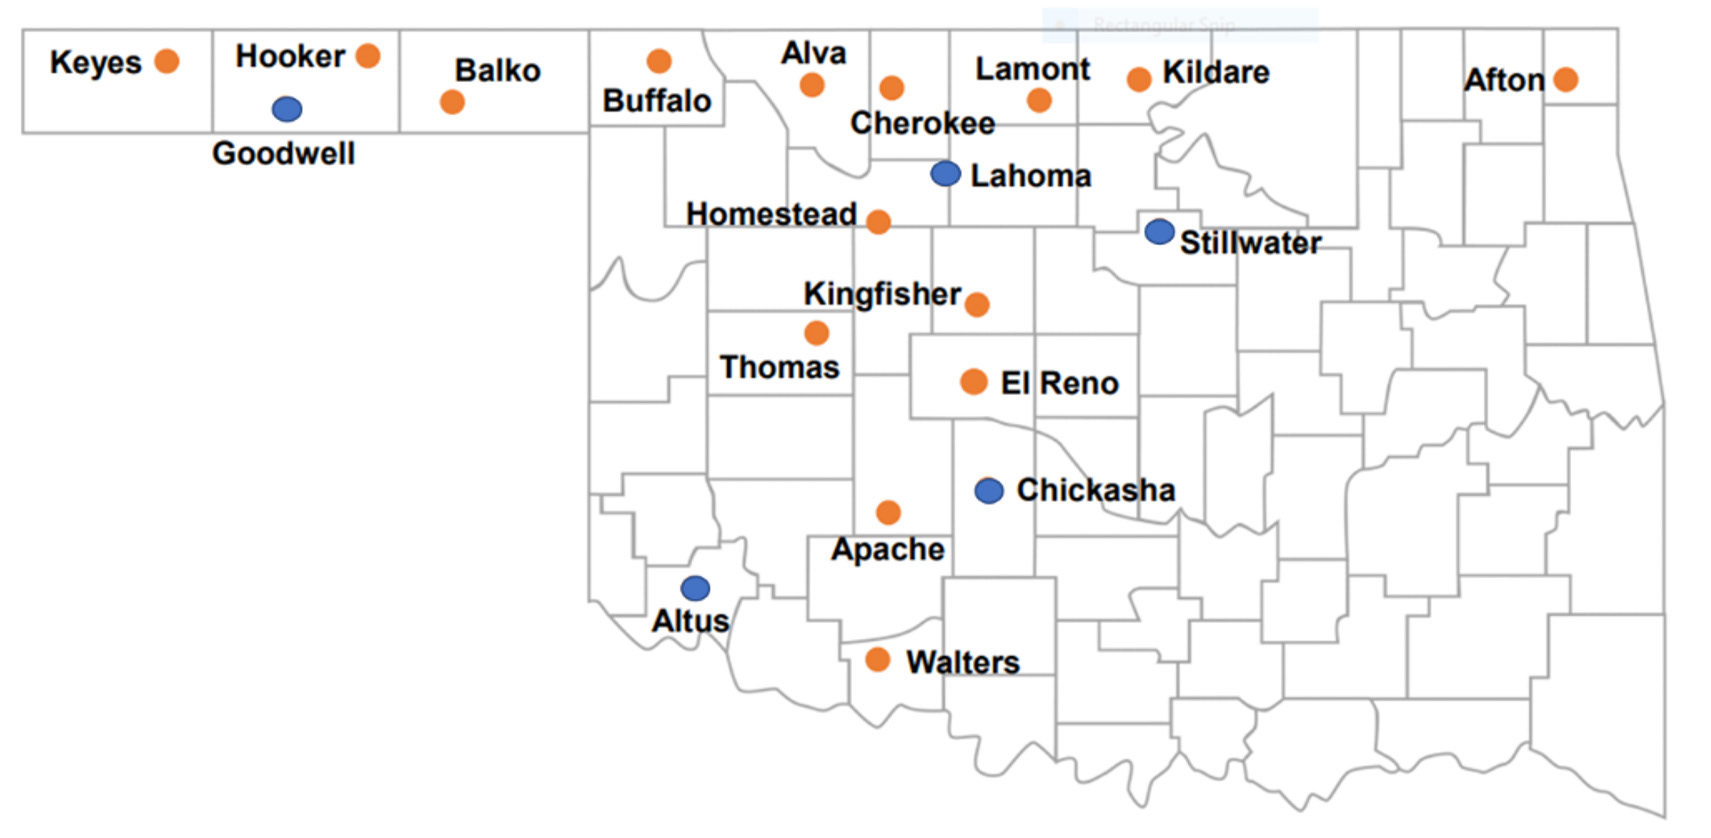
Figure 1. Current locations for the Oklahoma small grains variety performance tests.
The data collected from these trials include grain yield in dual-purpose and grain-only production systems, forage yield (Figure 2), response to fungicide application, adaptability to different environments, high- temperature sensitivity to germination, plant height, first hollow stem date, and heading date.
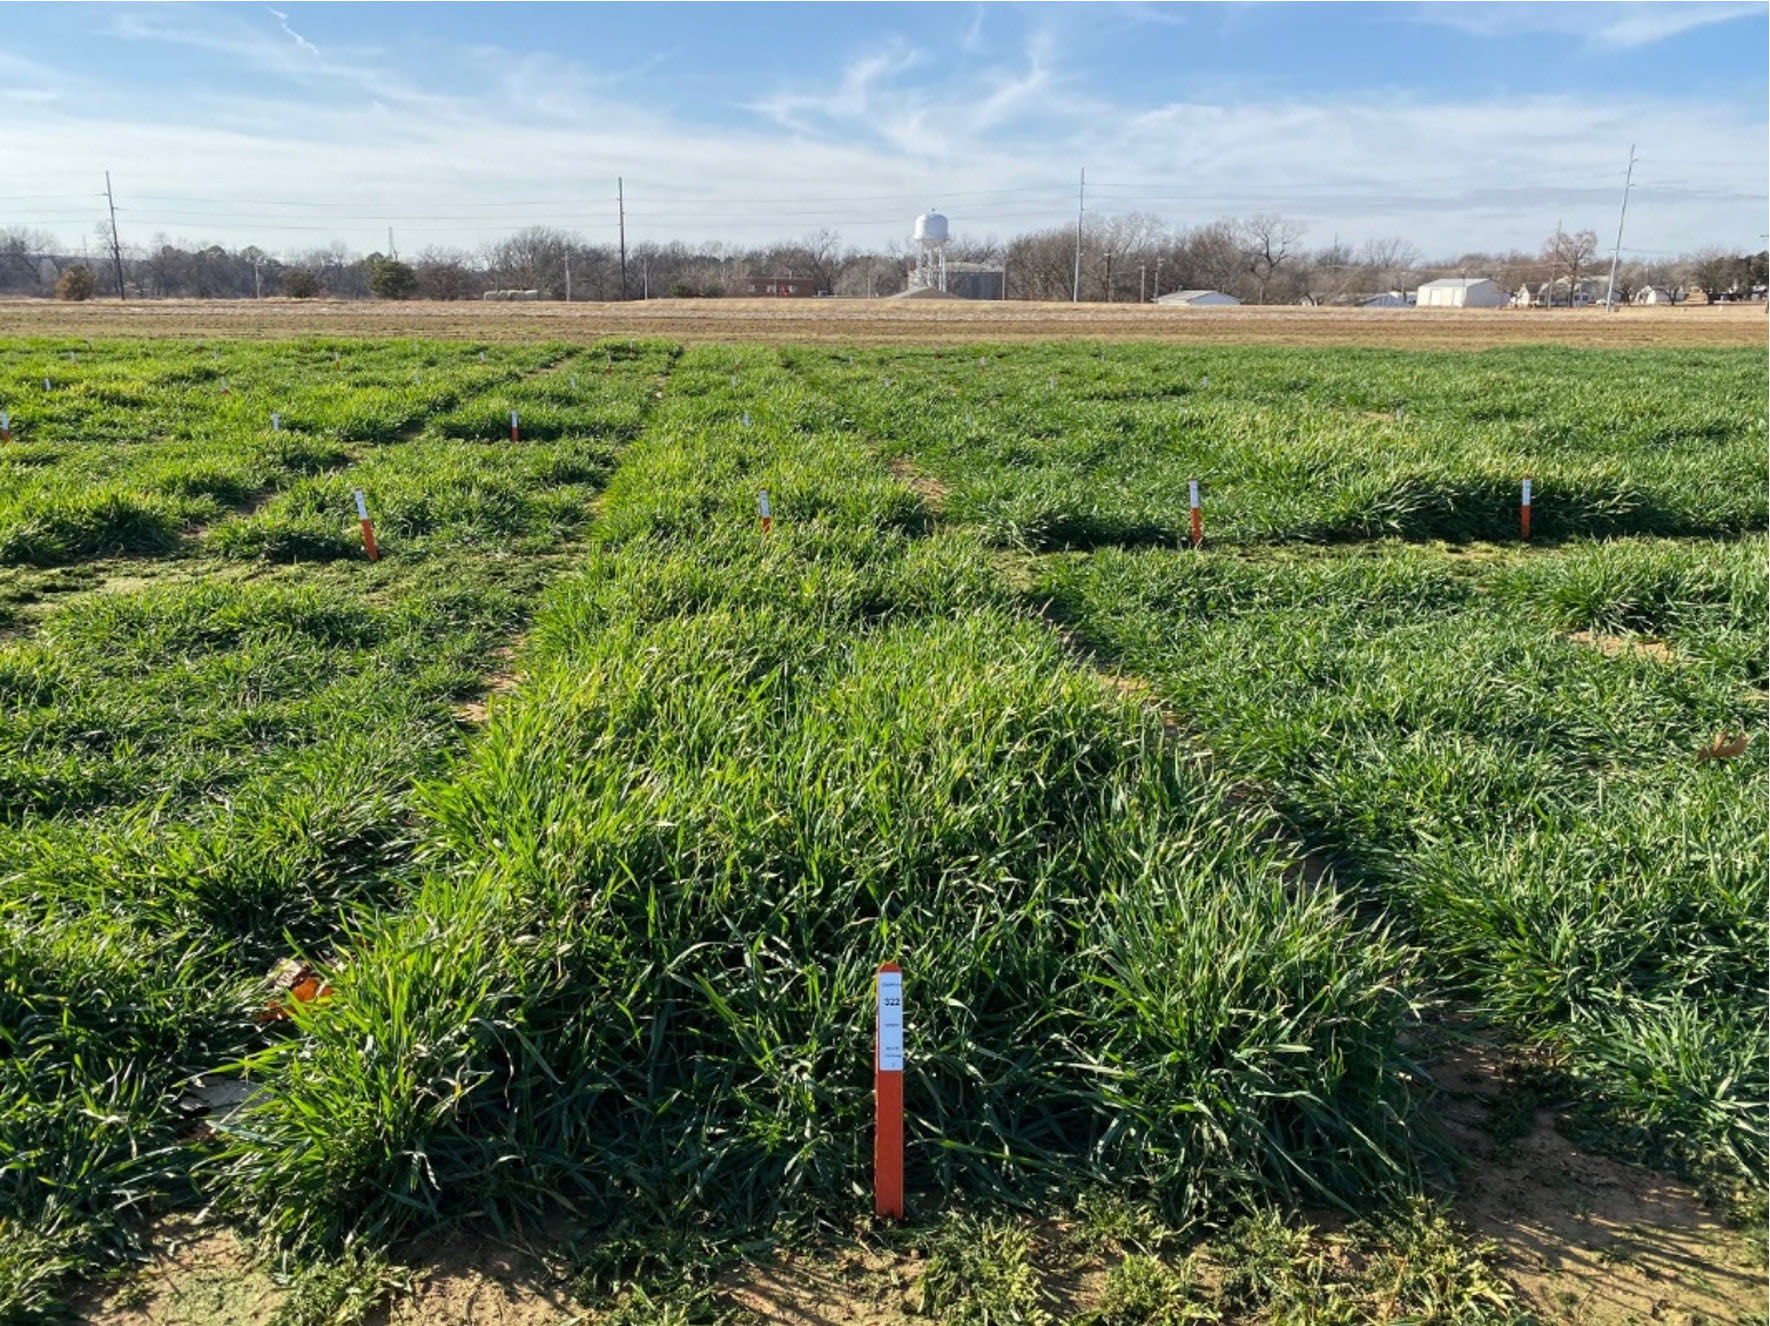
Figure 2. Forage yield trials conducted in Stillwater as published in CR-2141, “Fall Forage Production and First Hollow Stem Date for Wheat Varieties,” during the 2019-2020 Crop Year.
Information regarding variety performance and characteristics was distributed in 2020 through extension publications CR-2141, (Fall Forage Production and First Hollow Stem Date for Wheat Varieties), CR-2143 (2019-2020 Small Grains Variety Performance Tests) and CR-2135 (2019-2020 Protein Content of Winter Wheat Varieties in Oklahoma) — oral presentations and web-based communication outlets. Additionally, field maps and variety signs were installed at each site for producers interested in conducting a self-guided plot tour, and variety information could be accessed via QR-coded signage (Figure 3). The variety trials are the most influential decision aid used by wheat producers in their planting operations. These data represent an unbiased source of information to help growers make more informed decisions and are the only source of variety performance data for the dual-purpose production system in Oklahoma.
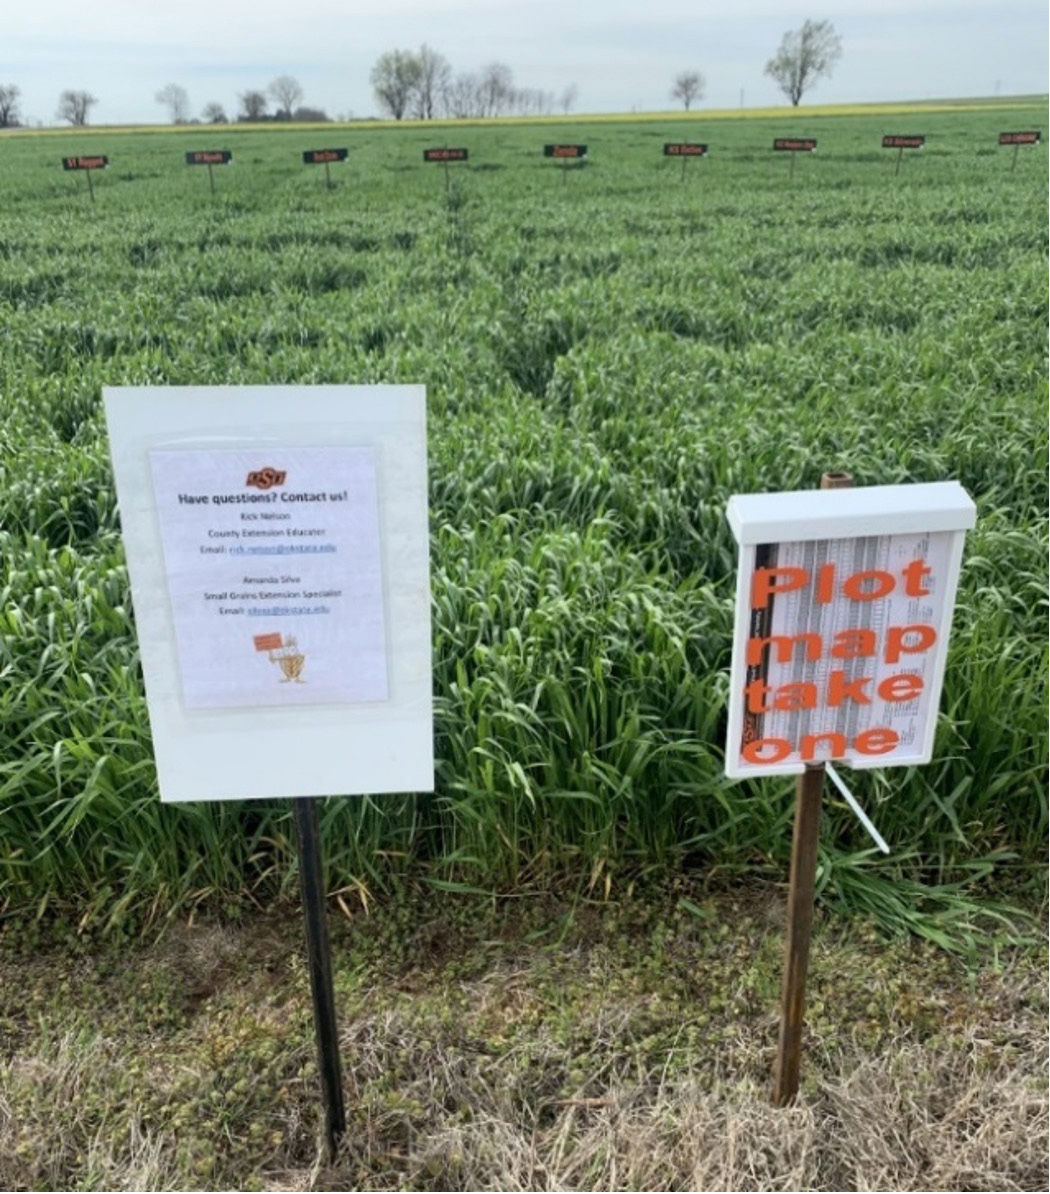
Figure 3. On-site field maps were provided for producers interested in conducting a self-guided plot tour, and variety information could be accessed via QR-coded signage.
Variety responsiveness to changing environments
A classical stability analysis was conducted for a common set of 10 varieties tested across 16 environments in the 2020 wheat variety trials. Using the mean of all varieties tested at a given site as the environment index, responsiveness to increasing productivity levels (grain yield) or to increasing wheat protein levels was quantified by the slope of the linear regression for each variety. The regressions were forced through the origin, leading to heterogeneity among the 10 slopes for each trait.
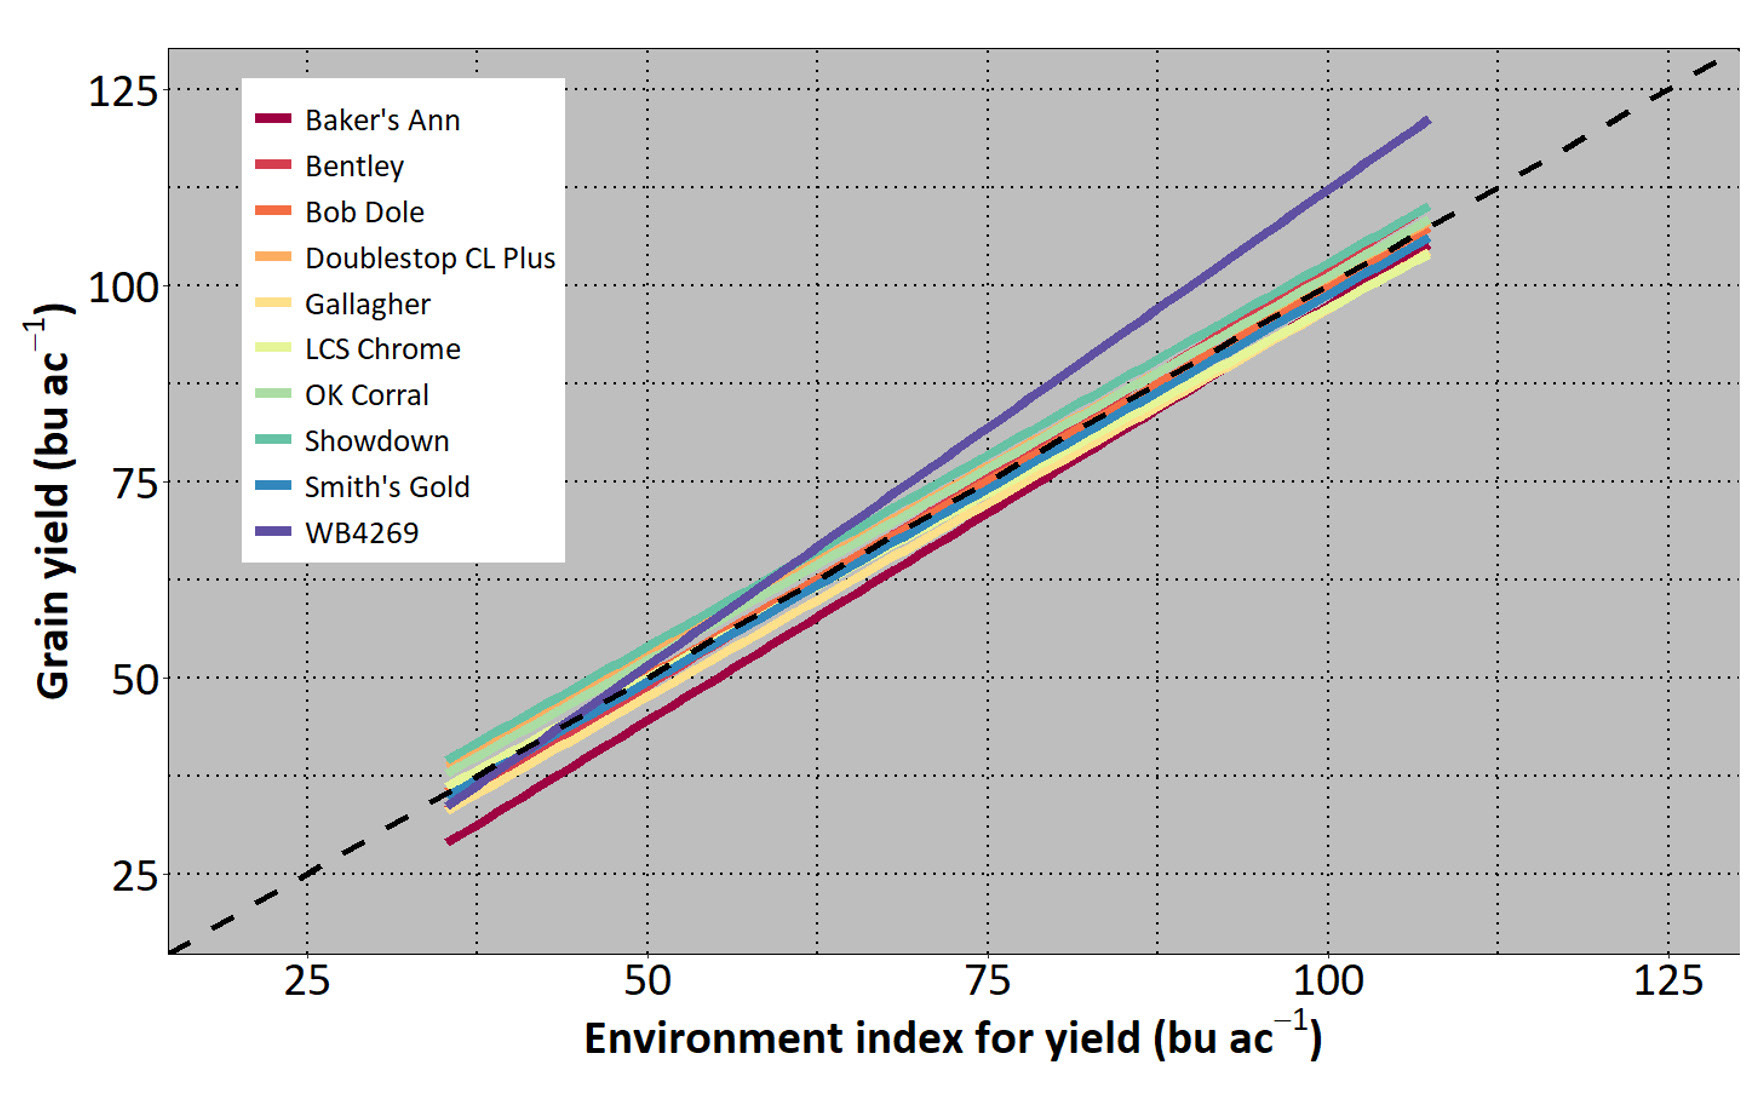
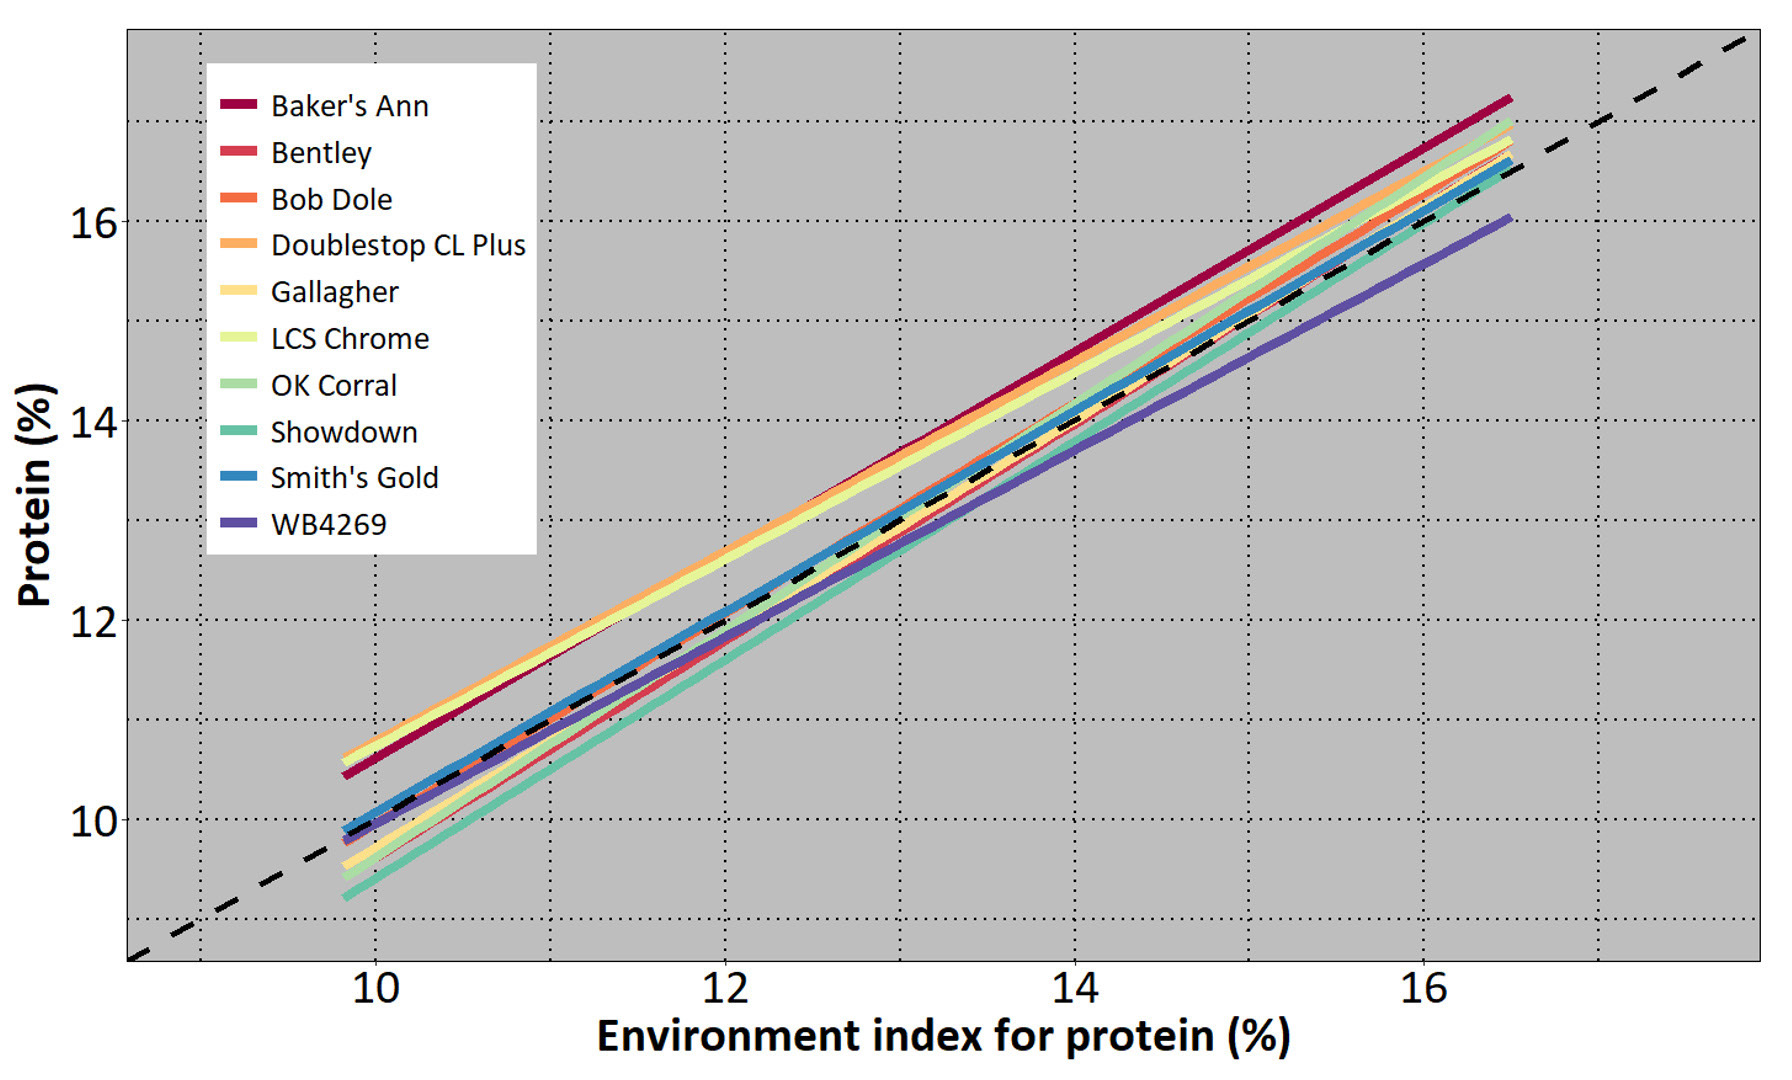
Figure 4. Relationship between A) grain yield and B) wheat protein of each variety versus the environment index, computed as the mean of all varieties tested in each environment in the 2019-2020 Oklahoma Small Grains Variety Performance Test. Analysis was conducted only for the 10 varieties planted in all 16 environments in the 2019-2020 growing season.
The dotted line in Figure 4 represents a unit slope or average responsiveness in yield or wheat protein to the environment index. Slopes greater or lesser than one (variety responses) represent more or less responsiveness to the environment index. Regression lines consistently above the unit line indicate a consistently high mean for a given variety across environments. Ideally, the most desirable plotted line would be positioned above the unit line and with a slope greater than one, indicating high mean and high responsiveness. This is rarely the case. For example, the variety WB 4269 was highly responsive to increasing yield levels of the environment. Higher-yielding environments provided better separation of WB 4269 versus the other varieties. On the other hand, WB 4269 could not capitalize on higher-protein environments, showing a smaller slope (flatter curve) relative to other varieties. Showdown and OK Corral proved to be stable, maintaining their yield level consistent with the productivity level of the environment. For wheat protein, Baker’s Ann, Doublestop CL Plus and LCS Chrome showed consistently higher protein values than the other varieties, especially in the range of protein values normally encountered or expected (11% to 14%). Considering 12% as the target for hard red winter wheat protein, those varieties were able to produce 12% wheat protein before the environment mean reached 12%.
