Evaluating Image Processing Methods for High-Throughput Phenotyping 2024
After planting, regular flights at the Stillwater and Lahoma locations for the Dual-Purpose Observation Nursery at Oklahoma State University commenced using a DJI Phantom 4 Multispectral Unmanned Aircraft System (UAS). Flight frequency was once per week during the fall and twice per month during the winter for Stillwater and once per month for Lahoma. For each flight, multiple raw multispectral images were collected, covering the whole field with approximately 80% overlap between images. The general procedure used for processing raw images was described in Unmanned Aerial Systems-Based High-Throughput Phenotyping 2023.
During 2024, two ongoing studies were initiated to evaluate different aspects of the image processing pipeline for improving the efficiency of the procedures and quality of the imagery produced. In the first study, the conventional approach to image processing was compared with several commonly used open-source and proprietary software programs to assess whether or not proprietary software produced imagery with higher quality. As illustrated in Figure 1, the conventional approach to image processing involves relying on the software program to perform radiometric calibration, ortho-rectification and ortho-mosaicking to produce a combined image of the field, called an orthophoto. This orthophoto is then used to calculate a set of vegetation index (VI) values, such as the Normalized Difference Vegetation Index (NDVI). In this study, the conventional approach to image processing was followed using three software programs, one that was open source (Open Drone Map; ODM) and two that were proprietary (Agisoft Metashape and Pix4D). In the second study, the conventional approach of processing imagery was compared to an alternative approach of processing imagery that more closely follows the procedure recommended by the camera manufacturer. As illustrated in Figure 1, the alternative, proposed approach performed radiometric calibration and calculation of VI values on individual images before using ODM to perform ortho-rectification and ortho-mosaicking. The radiometric calibrations step followed the procedure described in the DJI P4 Multispectral Processing Guide. In both studies, the result of each unique processing approach was an image of the whole field with various vegetation indices, such as the NDVI (Figure 2). Polygons generated for each field plot were used to extract plot-level data for each plot, and the resulting values for each software/processing approach were used to compare the results.
Figure 1. Diagram of image processing steps used in the conventional approach and an alternative proposed approach. The conventional approach uses Open Drone Map (ODM) to perform radiometric calibration, and the calculation of vegetation index (VI) values is performed after ortho-mosaicking. The proposed approach performs radiometric calibration and calculation of VI values on individual images before using ODM to perform the ortho-rectification and ortho-mosaicking.
Figure 2. Field plot polygons (yellow rectangles) used for extracting plot-level phenotypes overlaid onto an image of Normalized Difference Vegetation Index (NDVI) calculated from a multispectral orthomosaic image.
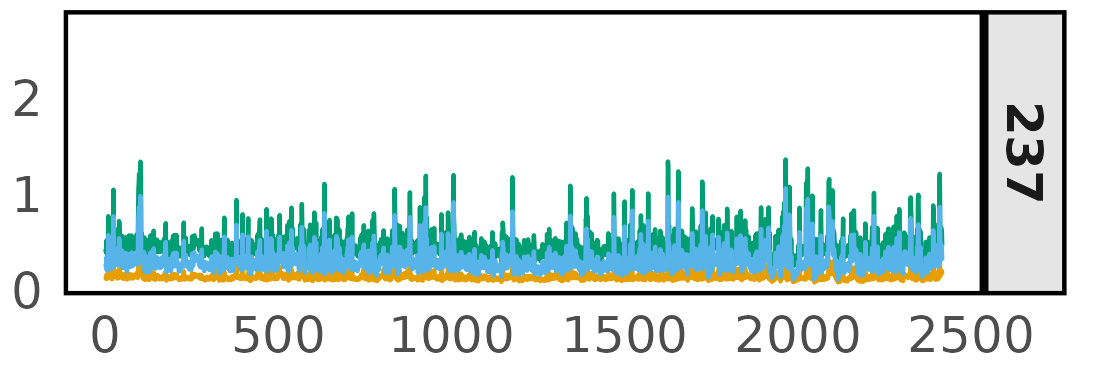
Figure 3 shows preliminary results from the first study. For most VIs, the results were similar to NDVI, namely, values were similar for all software programs evaluated across all dates for the 2023-2024 season. The values for the Enhanced Vegetation Index (EVI) had the greatest differences between software programs (Figure 3). Although EVI showed overall differences between software programs, the relative differences between plots were much smaller, leading to a high correlation in the plot-level VI values for most dates.
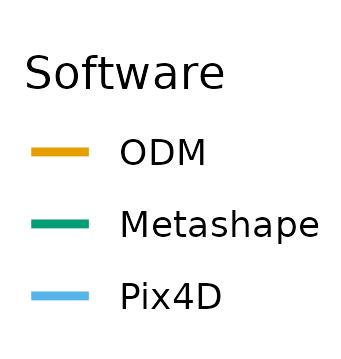
Figure 3. Comparison of Normalized Difference Vegetation Index (NDVI; panel a) and Enhanced Vegetation Index (EVI; panel b) values throughout the 2023-2024 season. Gray facet labels indicate the number of days after planting. Colors indicate the different software programs used for processing, including Open Drone Map (ODM), Agisoft Metashape (Metashape) and Pix4D.
Figure 3a-1. NDVI; panel a - 146 days after planting.
Figure 3a-2. NDVI; panel a - 172 days after planting.
Figure 3a-3. NDVI; panel a - 190 days after planting.
Figure 3a-4. NDVI; panel a - 205 days after planting.
Figure 3a-5. NDVI; panel a - 222 days after planting.
Figure 3a-6. NDVI; panel a - 237 days after planting.
Figure 3b-1. EVI; panel b - 146 days after planting.
Figure 3b-2. EVI; panel b - 172 days after planting.
Figure 3b-3. EVI; panel b - 190 days after planting.
Figure 3b-4. EVI; panel b - 205 days after planting.
Figure 3b-5. EVI; panel b - 222 days after planting.
Figure 3b-6. EVI; panel b - 237 days after planting.
Figure 3c. Software Legend. Orange represents ODM, Green represents Metashape and Blue represents Pix4D.
Figure 4 shows the levels of correctly predicted ratings for Barley Yellow Dwarf virus (BYD) and stay-green (SGC) ratings based on the VI values from each software program. For NDVI, the numbers of correctly predicted ratings were very similar for all categories. For EVI, the results were similar with small but detectable differences between software programs across different ratings categories. However, no software program had generally higher performance than any other. Taken together, these preliminary results do not indicate any advantage with using proprietary software (Metashape and Pix4D) over the open-source software (ODM).
Figure 4. Correctly predicted category (0-1, 2, 3, 4-6) for barley yellow dwarf virus (BYD) at Stillwater and stay-green (SGC) at Lahoma based on Normalized Difference Vegetation Index (NDVI; panel a) and Enhanced Vegetation Index (EVI; panel b) values produced using different software for image processing. Colors indicate the different software programs used for processing, including Open Drone Map (ODM), Agisoft Metashape (Metashape) and Pix4D.
| Image | Description |
|---|---|
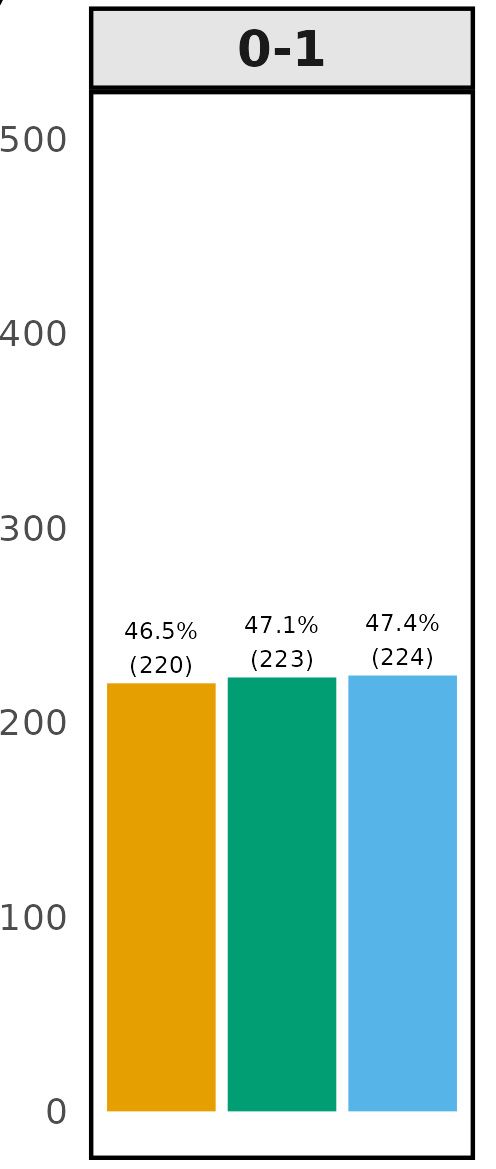 |
Figure 4a-1. Number of Genotypes with Correctly Predicted Disease Category for NDVI; panel a - BYD 0-1. |
 |
Figure 4a-2. Number of Genotypes with Correctly Predicted Disease Category for NDVI; panel a - SGC 0-1. |
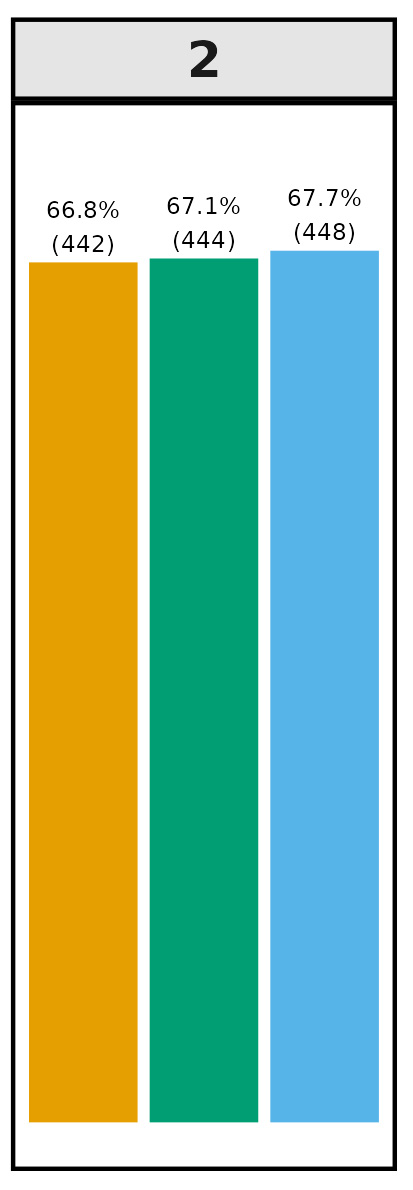 |
Figure 4a-3. Number of Genotypes with Correctly Predicted Disease Category for NDVI; panel a - BYD 2. |
 |
Figure 4a-4. Number of Genotypes with Correctly Predicted Disease Category for NDVI; panel a - SGC 2. |
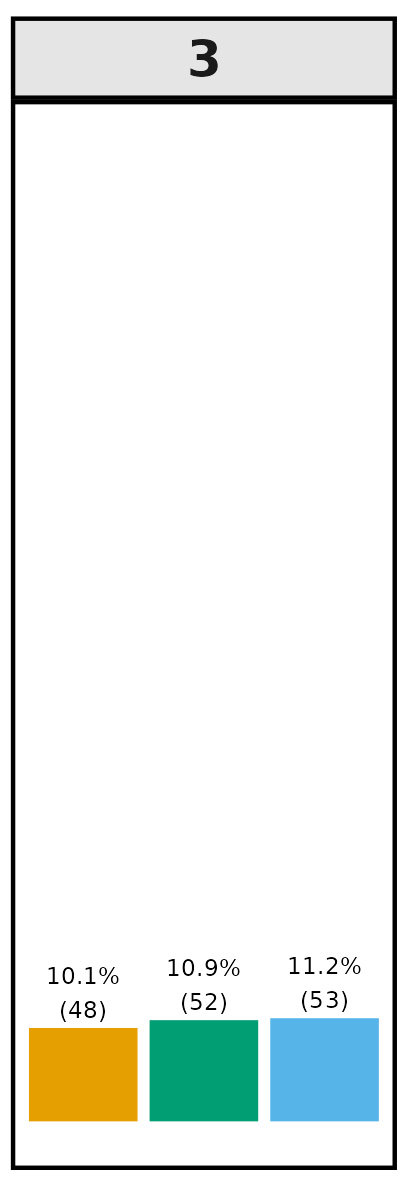 |
Figure 4a-5. Number of Genotypes with Correctly Predicted Disease Category for NDVI; panel a - BYD 3. |
 |
Figure 4a-6. Number of Genotypes with Correctly Predicted Disease Category for NDVI; panel a - SGC 3. |
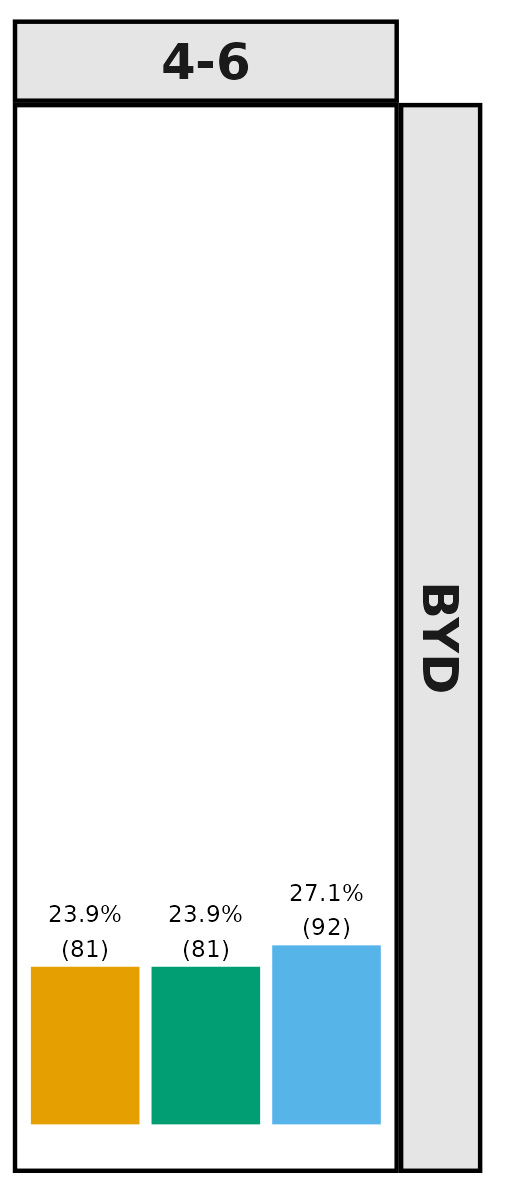 |
Figure 4a-7. Number of Genotypes with Correctly Predicted Disease Category for NDVI; panel a - BYD 4-6. |
 |
Figure 4a-8. Number of Genotypes with Correctly Predicted Disease Category for NDVI; panel a - SGC 4-6. |
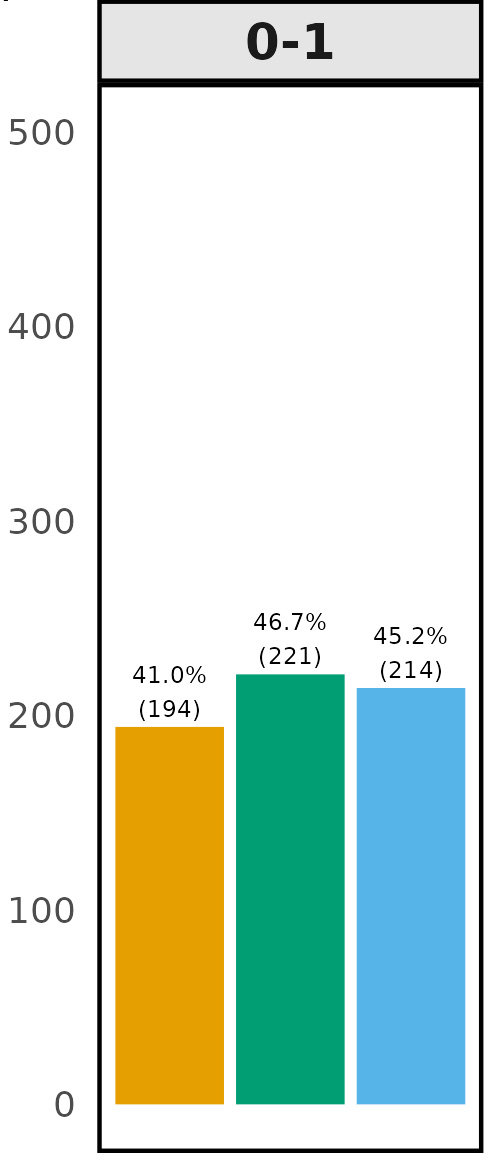 |
Figure 4b-1. Number of Genotypes with Correctly Predicted Disease Category for EVI; panel b - BYD 0-1. |
 |
Figure 4b-2. Number of Genotypes with Correctly Predicted Disease Category for EVI; panel b - SGC 0-1. |
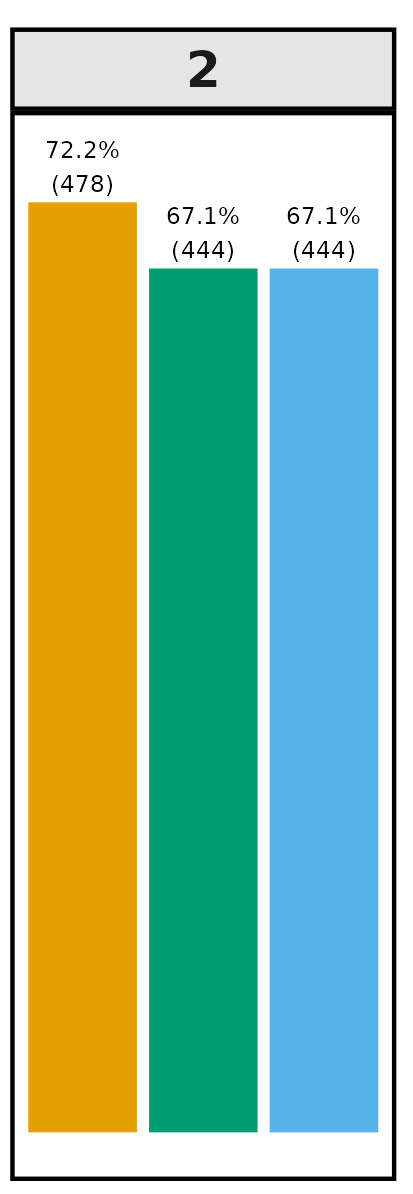 |
Figure 4b-3. Number of Genotypes with Correctly Predicted Disease Category for EVI; panel b - BYD 2. |
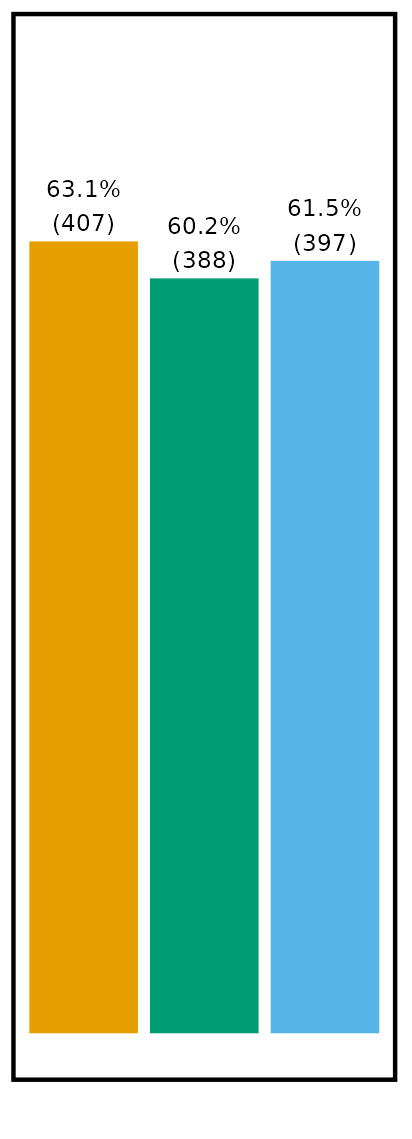 |
Figure 4b-4. Number of Genotypes with Correctly Predicted Disease Category for EVI; panel b - SGC 2. |
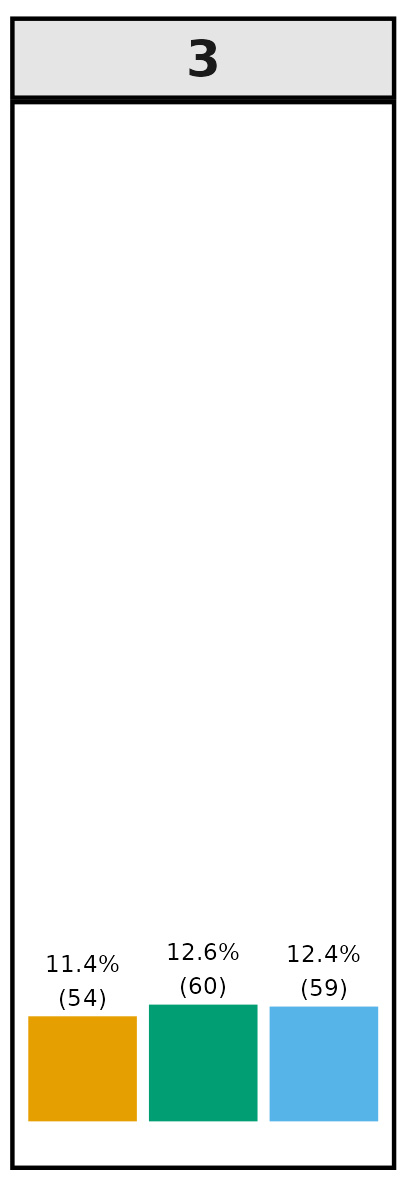 |
Figure 4b-5. Number of Genotypes with Correctly Predicted Disease Category for EVI; panel b - BYD 3. |
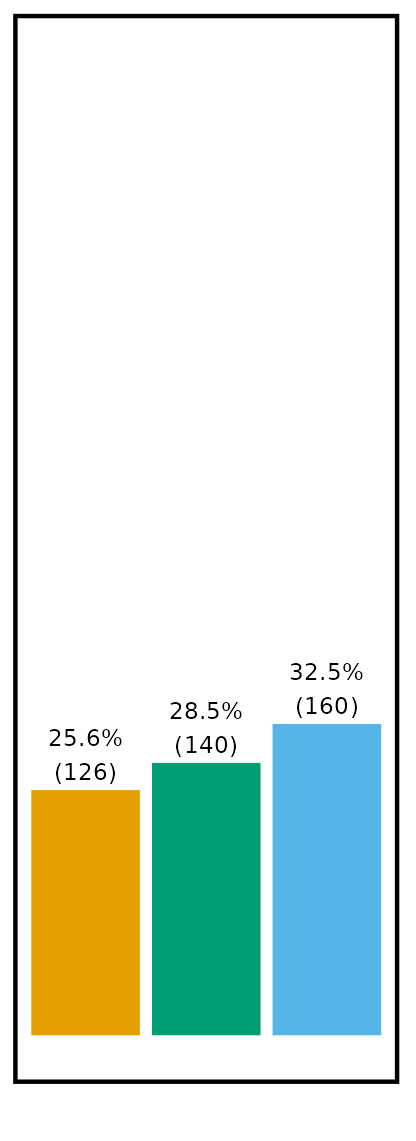 |
Figure 4b-6. Number of Genotypes with Correctly Predicted Disease Category for EVI; panel b - SGC 3. |
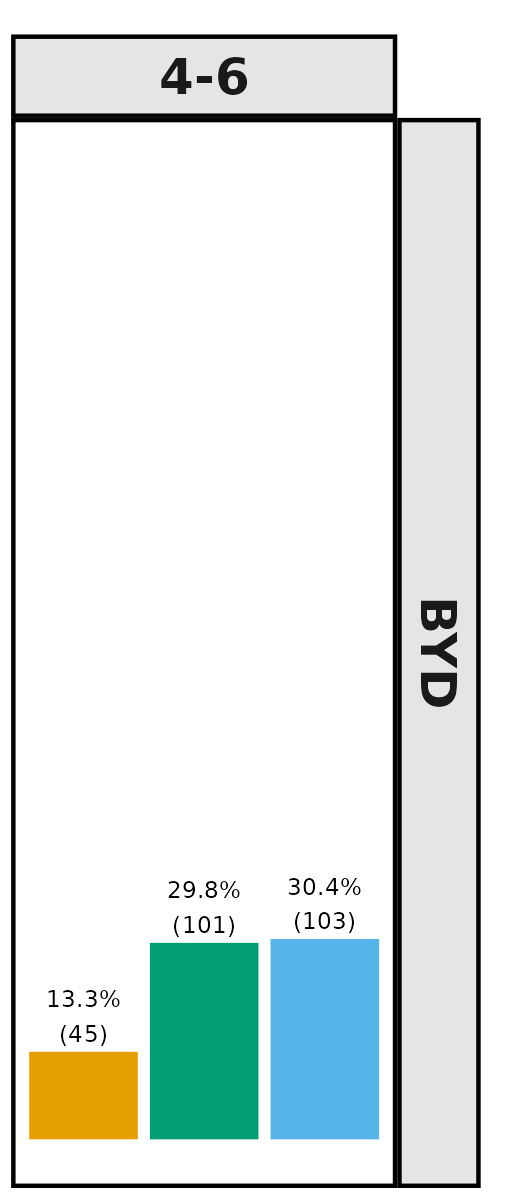 |
Figure 4b-7. Number of Genotypes with Correctly Predicted Disease Category for EVI; panel b - BYD 4-6. |
 |
Figure 4b-8. Number of Genotypes with Correctly Predicted Disease Category for EVI; panel b - SGC 4-6. |
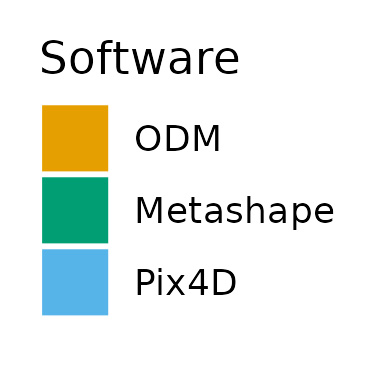 |
Figure 4c. Orange represents ODM, Green represents Metashape and Blue represents Pix4D. |
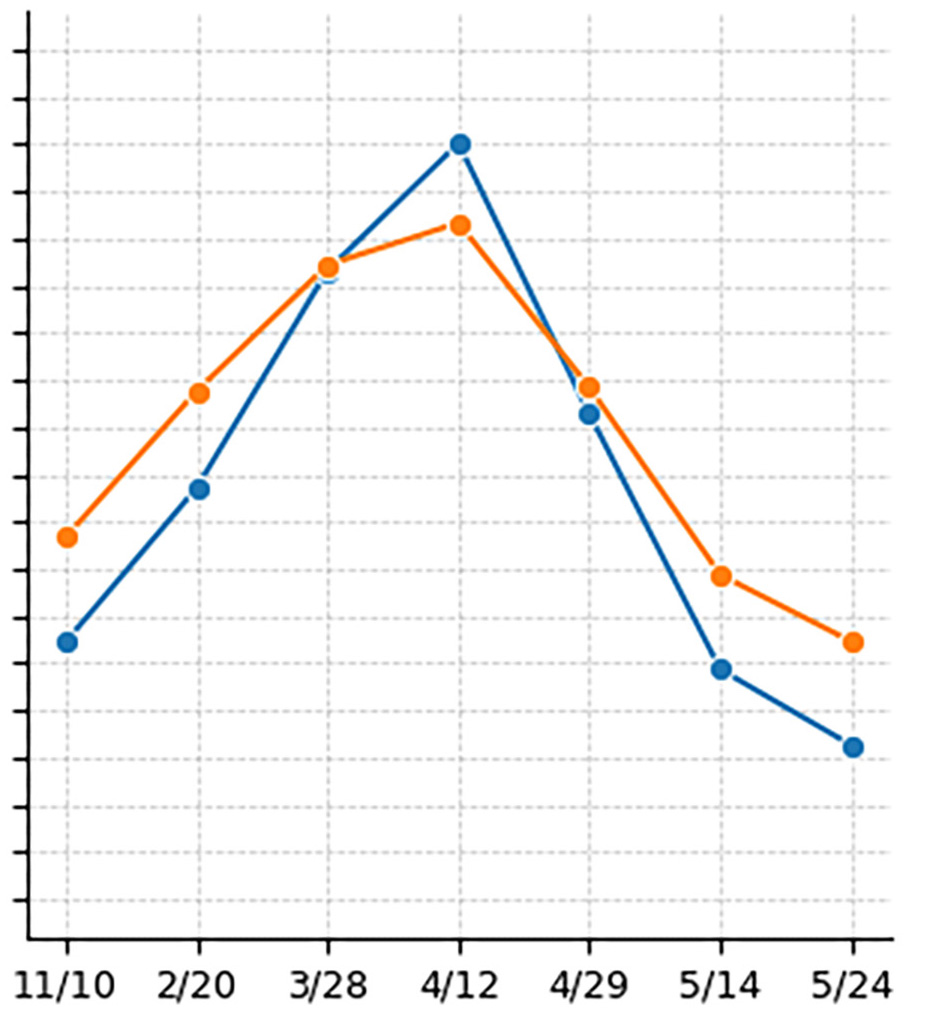
Results from the second study are shown in Figure 5. The results for all three evaluated VIs were similar and indicated generally lower values for the proposed approach early and late in the season. The opposite was true during the middle of the season with the proposed approach yielding higher values than the conventional approach.
Figure 5. Vegetation index values averaged across all plots for conventional and proposed image processing approaches at seven flight dates across the 2023-2024 season at Stillwater. Vegetation indices included Normalized Difference Vegetation Index (NVDI), Normalized Difference Red Edge (NDRE) and Green Normalized Difference Vegetation Index (GNDVI).
Figure 5a. Vegetation index mean and flight dates for Normalized Difference Vegetation Index.
Figure 5b. Vegetation index mean and flight dates for Normalized Difference Red Edge.
Figure 5c. Vegetation index mean and flight dates for Green Normalized Difference Vegetation Index.
Figure 5d. Processing Type Legend. Blue represents pre-stitching (proposed approach) and orange represents post-stitching (conventional approach).
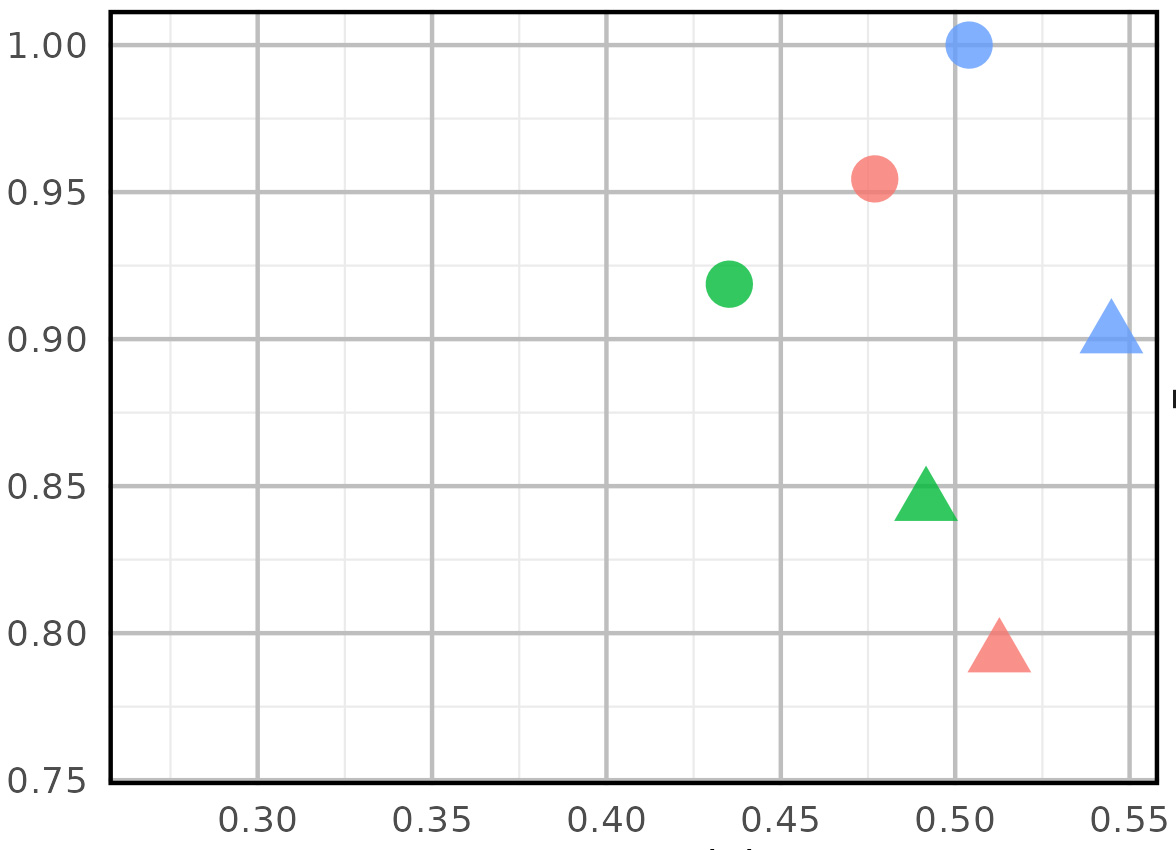
Figure 6 presents the results of using the resulting VI values to predict BYD ratings at Stillwater and SGC ratings at Lahoma. The rank correlation is on the y-axis and the macro precision is on the x-axis. Macro precision is an indicator of the overall quality of predictions with values closer to one indicating better predictions. The results were mixed depending on which rating was considered. For BYD, the proposed method had lower macro precision values compared to the conventional approach, despite having reasonably high-ranking correlation across VIs and approaches. In contrast, SGC showed consistently higher macro precision values for the proposed approach compared to the conventional approach. These preliminary results suggest that the value of the proposed approach may be context-specific. Further analysis is needed to better understand the drivers of these mixed results.
Figure 6. Rank-correlation and macro precision for predicting Barley Yellow Dwarf virus ratings at Stillwater (BYD_STW) and stay-green ratings at Lahoma (SGC_LAH) using conventional and proposed approaches for image processing with three vegetation indices: Normalized Difference Vegetation Index (ndvi_mean), Normalized Difference Red Edge (ndre_mean) and Green Normalized Difference Vegetation Index (gndvi_mean).
Figure 6a. Rank Correlation vs Macro Precision between Approaches for BYD at Stillwater.
Figure 6b. Rank Correlation vs Macro Precision between Approaches for SGC at Lahoma.
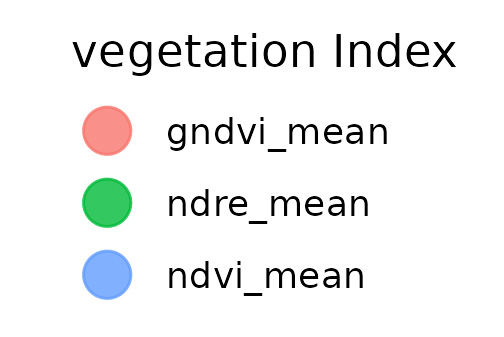
Figure 6c. Vegetation Index. Red represents gndvi_mean, green represents ndre_mean and blue represents ndvi_mean.
Figure 6d. Approach Legend. The circle represents conventional and the triangle represents proposed.


